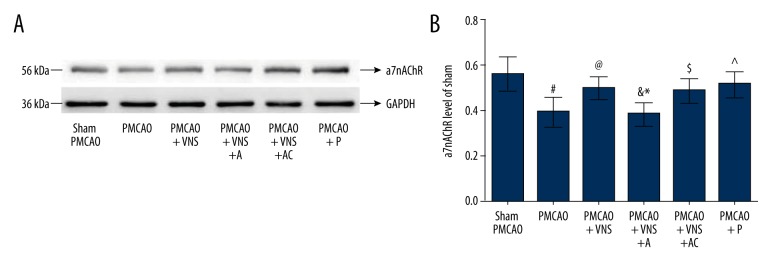
Figure 4.
Expression levels of a7nAChR protein in the ischemic penumbra. (A) Western blot analysis of a7nAChR expression in each group. GAPDH was used as an internal control. (B) Quantitative results from Western blot analysis. All data are expressed as mean ±SD. # p<0.05 versus the sham PMCAO group; & p<0.05 versus the sham PMCAO+VNS group; * p<0.05 versus the sham PMCAO+VNS+AC group; @, ^, $ p<0.05 versus the PMCAO group.

