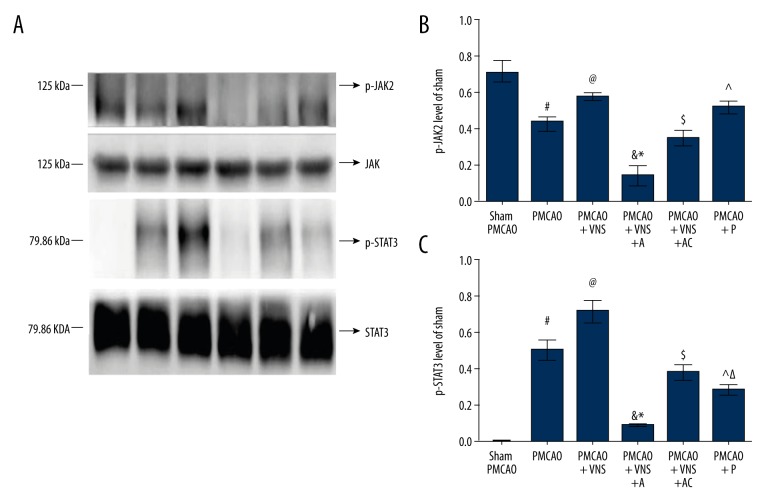
Figure 5.
Expression levels of p-JAK2 and p-STAT3 in the ischemic penumbra. (A) Western blot analysis of p-JAK2 and p-STAT3 expression levels in each group. GAPDH was used as internal controls. (B) Quantitative results of p-JAK2 expression levels. (C) Quantitative results of p-STAT3 expression levels. All data are expressed as mean ±SD. # p<0.05 versus the sham PMCAO group; Δ, & p<0.05 versus the sham PMCAO+VNS group; * p<0.05 versus the sham PMCAO+VNS+AC group; @, ^, $ p<0.05 versus the PMCAO group.

