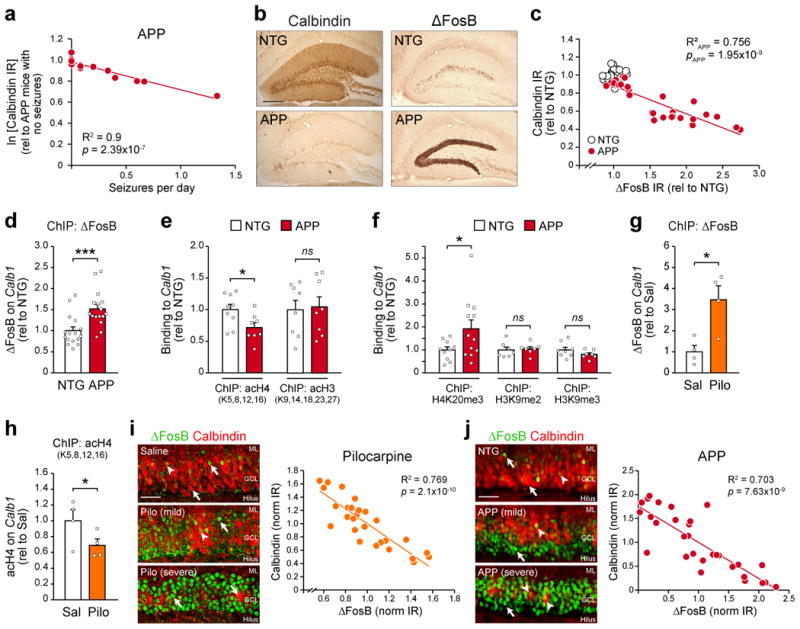
Figure 1. Epigenetic regulation of Calb1 in the hippocampus of APP and pilocarpine mice.

(a) Regression analysis of the relationship between hippocampal calbindin protein immunoreactivity (IR) and seizure frequency in 2-4 month-old APP mice (n=14 mice). IR values were transformed via natural log. (b) Representative images of hippocampal calbindin and ΔFosB IR in NTG and APP mice. Scale bar = 250 μm. (c) Regression analysis of calbindin and ΔFosB IR in APP mice (n=28 mice). NTG data points are also displayed (n=30 mice). (d) Binding of ΔFosB to the Calb1 promoter in the hippocampus of NTG and APP mice (n=16 mice/genotype, t30=3.72, ***p=8.3×10⁻⁴). (e) Levels of histone 4 (nNTG=9 mice, nAPP=8 mice, t15=-2.46, *p=0.026) and histone 3 (n=8 mice/genotype, t14=0.21, p=0.84) lysine acetylation on the Calb1 promoter of NTG and APP mice. (f) Levels of Calb1 histone 4 lysine 20 trimethylation (nNTG=10 mice, nAPP=12 mice, t20=2.09, *p=0.049), histone 3 lysine 9 dimethylation (n=7 mice/genotype, t12=0.31, p=0.76), and histone 3 lysine 9 trimethylation (nNTG=8 mice, nAPP=7 mice, t13=-1.38, p=0.19) in NTG and APP mice. (g) ΔFosB bound to Calb1 (n=4 mice/treatment, t6 =3.4, *p=0.015) and (h) Calb1 histone 4 lysine acetylation (n=4 mice/treatment, t6 =-1.94, one-tail *p=0.05) 3 days after pilocarpine-induced status epilepticus versus saline control. (i) Left, representative high-magnification images of ΔFosB and calbindin IR in the DG of pilocarpine-treated mice with mild (<2 stage five convulsions) or severe (>2 stage five convulsions) seizures during status epilepticus. Scale bar = 50 μm. Right, cell-by-cell regression analysis of ΔFosB and calbindin IR in a pilocarpine-treated mouse (n=30 cells). (j) Left, high-magnification images of hippocampal ΔFosB and calbindin IR in APP mice with varying severities of epilepsy. Right, cell-by-cell regression analysis of ΔFosB and calbindin IR in an APP mouse (n=30 cells). Scale bar = 50 μm. Arrowheads, granule cells double-labeled with both ΔFosB and calbindin. Arrows, granule cells single-labeled with either ΔFosB or calbindin. GCL, granule cell layer. ML, molecular layer. ns, non-significant. Data in panels (d-g) were analyzed using Student's t-tests. Error bars represent SEM.
