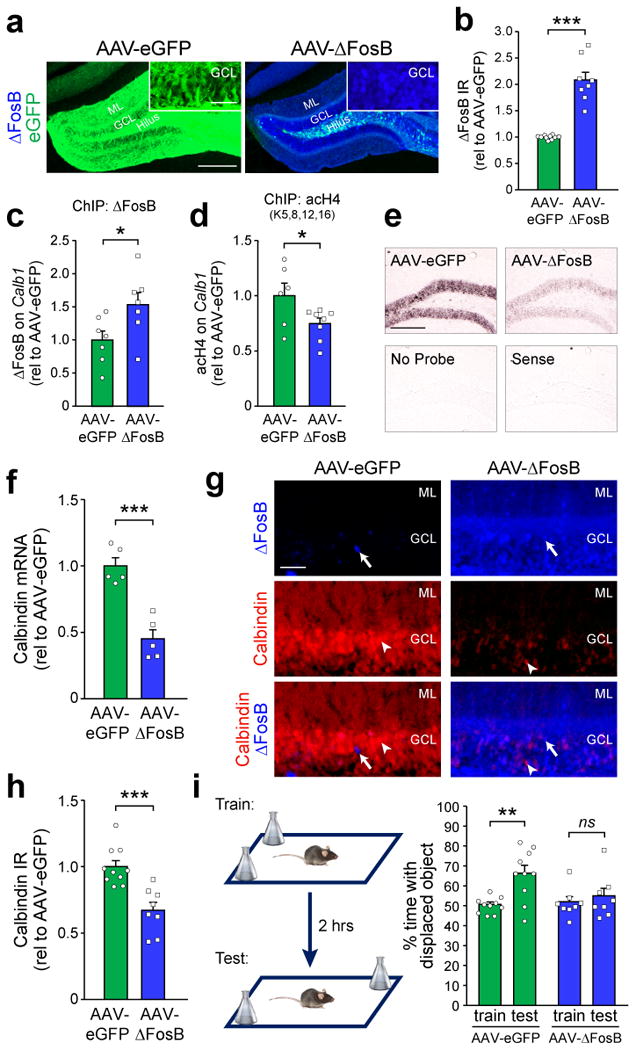
Figure 2. ΔFosB mediates transcriptional repression of Calb1 expression and causes spatial memory deficits.

(a,b) Representative images and quantification of ΔFosB IR in the DG of wild-type mice that received bilateral hippocampal infusion of AAV carrying either ΔFosB/eGFP (AAV-ΔFosB) or eGFP alone (AAV-eGFP) (neGFP=10 mice, nΔFosB=8 mice, t16=8.23, ***p=3.83×10⁻⁷). eGFP expression is also displayed and can be observed in the cell bodies (GCL), axons (hilus), and dendrites (ML) of AAV-eGFP granule cells. Scale bars = 250 μm and 50 μm (inset). (c) Binding of ΔFosB (n=7 mice/treatment, t12=2.36, *p=0.036) and (d) histone 4 lysine acetylation (neGFP=6 mice, nΔFosB=8 mice, t12=-2.21, *p=0.047) on Calb1 in AAV-eGFP and AAV-ΔFosB mice. (e,f) In situ hybridization of calbindin mRNA (n=5 mice/treatment, t8=-5.94, ***p=3.44×10⁻⁴). Scale bar = 250 μm. (g,h) Calbindin protein IR (neGFP=10 mice, nΔFosB=8 mice, t16=-4.46, ***p=4×10⁻⁴) in DG granule cells of AAV-eGFP and AAV-ΔFosB mice. In panel (g), arrows indicate ΔFosB-expressing granule cells, and arrowheads indicate calbindin-expressing granule cells. Scale bar = 50 μm. (i) Left, object location test procedure. Right, performance of AAV-eGFP and AAV-ΔFosB mice in the object location test (paired t-tests: AAV-eGFP, n=10 mice, t9=4.6, **p=0.0013; AAV-ΔFosB, n=8 mice, t7=1.24, p=0.25). Data in panels (a-h) were analyzed using Student's t-tests. Error bars represent SEM.
