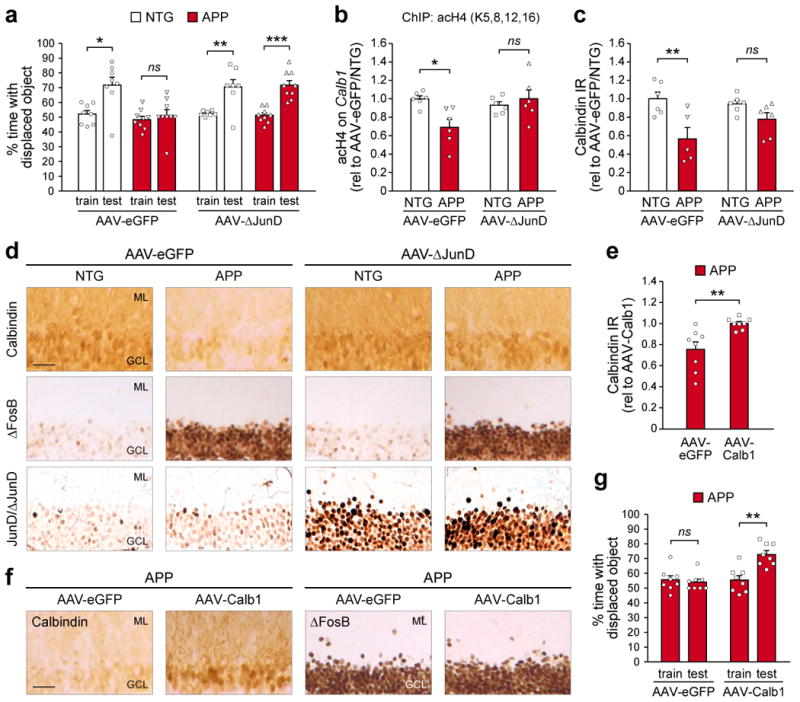
Figure 3. Both blockade of ΔFosB signaling and direct rescue of calbindin expression ameliorate spatial memory deficits in APP mice.

(a) Object location test performance of NTG and APP mice treated with bilateral hippocampal infusion of AAV carrying either ΔJunD/eGFP (AAV-ΔJunD) or eGFP alone (AAV-eGFP) (paired t-tests: AAV-eGFP/NTG, n=8 mice, t7=2.9, *p=0.023; AAV-eGFP/APP, n=9 mice, t8=0.55, p=0.6; AAV-ΔJunD/NTG, n=7 mice, t6=3.63, **p=0.01; AAV-ΔJunD/APP, n=9 mice, t8=5.84, ***p=3.86×10⁻⁴). (b) Histone 4 lysine acetylation on the Calb1 promoter of NTG and APP mice treated with AAV-eGFP or AAV-ΔJunD (n=6 mice/group; two-way ANOVA: genotype F1,20=3.07 p=0.095, treatment F1,20=2.98 p=0.1, interaction F1,20=7.73 p=0.012; Tukey's HSD: AAV-eGFP/NTG vs. APP *p=0.021, AAV-ΔJunD/NTG vs. APP p=0.89). (c,d) Quantification and representative images of calbindin IR in NTG and APP mice treated with AAV-eGFP or AAV-ΔJunD (n=6 mice/group except AAV-eGFP/APP n=5 mice; two-way ANOVA: genotype F1,19=13.82 p=0.0015, treatment F1,19=0.58 p=0.46, interaction F1,19=3.45 p=0.079; Tukey's HSD: AAV-eGFP/NTG vs. APP **p=0.0056, AAV-ΔJunD/NTG vs. APP p=0.44). In panel (d), corresponding images of ΔFosB IR (middle row) and JunD/ΔJunD IR (bottom row) are also shown. Scale bar = 50 μm. (e,f) Quantification and images of calbindin IR in APP mice treated with either AAV carrying either CMV promoter-driven calbindin/eGFP (AAV-Calb1) or AAV-eGFP (n=8 mice/group; Student's t-test: t14=3.36, **p=0.0046). In panel (f), corresponding images of ΔFosB IR (right) are also shown. Scale bar = 50 μm. (g) Object location test performance of APP mice treated with AAV-eGFP or AAV-Calb1 (n=8 mice/group; paired t-tests: AAV-eGFP, t7=-0.45, p=0.67; AAV-Calb1, t7=3.89, **p=0.0059). Error bars represent SEM.
