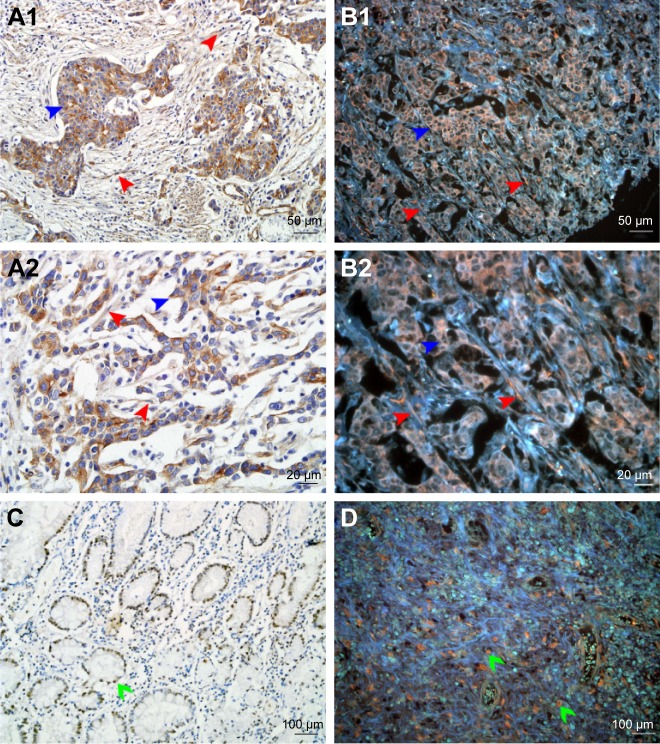
Figure 1.
Expression of LOX in GC.
Notes: (A1 and A2) LOX expressed in cytoplasm of cancer cells (blue arrows) and stromal cells (red arrows) revealed by IHC. (B1 and B2) LOX was stained orange and expressed in cytoplasm of cancer cells (blue arrows) and stromal cells (red arrows) revealed by QDs-585-conjugated antibody nanoprobe. (C) LOX expressed in nucleus of cancer cells (green arrows) revealed by IHC. (D) LOX expressed in nucleus of tumor cells (green arrows) revealed by QDs-585 probe-based single molecular imaging. Magnification: 200× (A1, B1, C and D), 400× (A2 and B2), 100× (C and D). Scale bar: 50 μm for (A1 and B1), 20 μm for (A2 and B2) and 100 μm for (C and D).
Abbreviations: LOX, lysyl oxidase; GC, gastric cancer; IHC, immunohistochemistry; QD, quantum dot.

