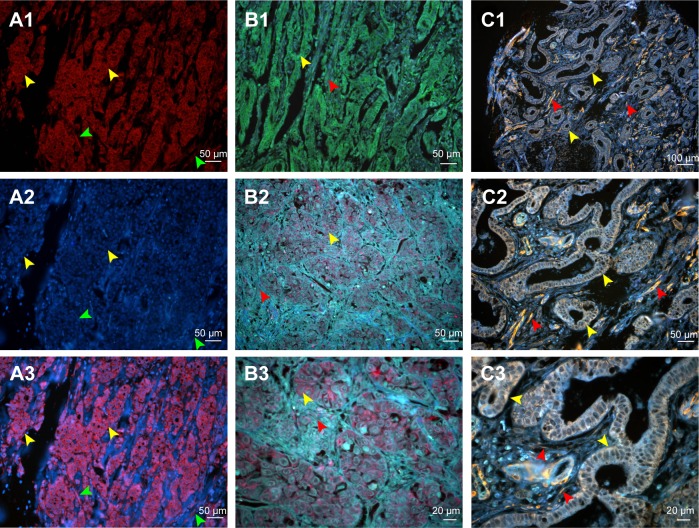
Figure 2.
Comparison of conventional fluorescent dyes and QD-based molecular probe.
Notes: (A1) The expression of LOX in GC cells revealed by Cy3 fluorescent imaging (excited by 570 nm emission fluorescence, yellow arrows). Cell nuclei are indicated by green arrows. (A2) Cell nucleus revealed by DAPI (green arrows). Cytoplasms are indicated by yellow arrows. (A3) Merged imaging of A1 and A2; LOX expressed in GC cells (yellow arrows) and stromal cells (green arrows). (B1) The expression of LOX in GC revealed by DyLight 488 in GC cells (yellow arrows) and stromal cells (red arrows) (merged image). (B2 and B3) The LOX was stained red and expressed in GC cells (yellow arrows) and stromal cells (red arrows), which was revealed by QDs-655 imaging probes. (C1–C3) The LOX was stained yellow and expressed in GC cells (yellow arrows) and stromal cells (red arrows), which was revealed by QDs-585 imaging probes. Magnification: 200× (A1–A3, B1, B2 and C2), 400× (B3 and C3) and 100× (C1). Scale bar: 50 μm for (A1–A3, B1, B2 and C2), 20 μm for (B3 and C3) and 100 μm for (C1).
Abbreviations: QD, quantum dot; LOX, lysyl oxidase; GC, gastric cancer; DAPI, 4′,6-diamidino-2-phenylindole.

