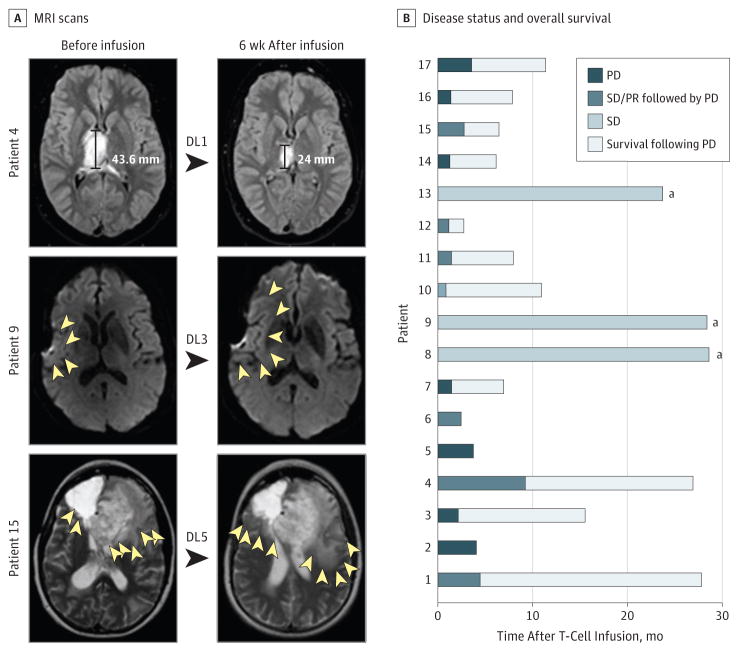
Figure 2. Clinical Outcome After HER2–Chimeric Antigen Receptor Virus-Specific T-Cell (HER2-CAR VST) Infusions.
A, Magnetic resonance imaging (MRI) scan of the brain before and 6 weeks after HER2-CAR VST infusion. The MRI scan of patient 4 shows a partial response (PR); MRI scans of patients 9 and 15 show increased edema after HER2-CAR VST infusions (yellow arrowheads outline the margin of edema). B, Swimmer plot showing disease status and overall survival in 17 patients treated with HER2-CAR VSTs. DL indicates dose level; PD, progressive disease; PR, partial response; and SD, stable disease.
aAlive.

