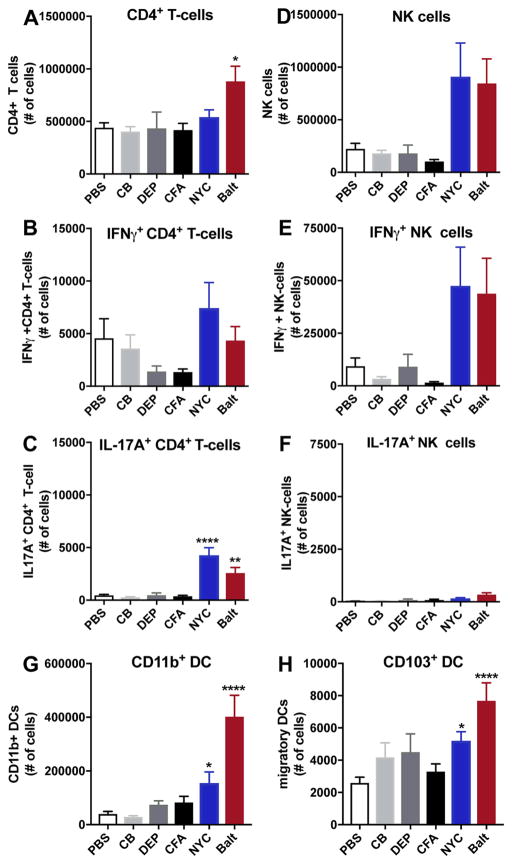
Figure 3. Identification of cytokine-producing cells and antigen-presenting cell profile in the lungs of PM-exposed mice.
Single cell suspension from PM-exposed mice were analyzed by flow cytometry for total CD3+CD4+ T cells (A), IFNγ+CD4+ T cells (B), and IL-17A+CD4+ T cells (C), total NK cells (CD3–NK1.1+) (D), (IFNγ+ NK (E) and IL-17A+NK (F). Numbers of CD11b+ DCs (G), and CD103+ migratory DCs (H). Data represents means +SEM, pooled from 2 independent experiments (10 mice/group). *compared to PBS. *p<0.05, ****p<0.0001.

