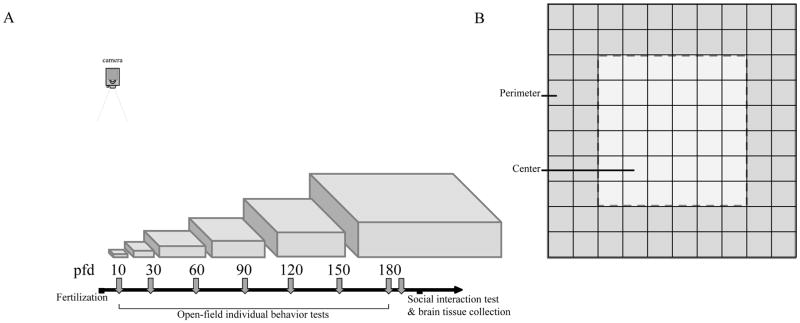
Figure 1.
(A) Experimental timeline showing ages (in post-fertilization days; pfd) when open-field behavior of experimental fish was recorded across development. The arena sizes (proportional to the length of experimental fish) used for the open-field testing are also shown. (B) Representation of the open-field perimeter and center used to quantify thigmotaxis (wall-hugging) with a grid pattern shown. Perimeter is defined as two liner unit area close to the wall. Center is the 6 × 6 liner unit square in the middle of the open-tank. Greater percentage of time spent in the perimeter indicate increased thigmotaxis, while higher number of entries in the center square indicate center exploration, i.e., reduced thigmotaxis.

