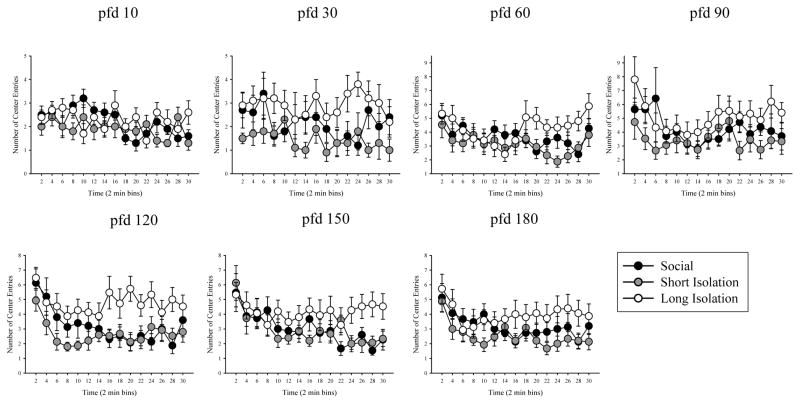
Figure 5.
Average number of entries made in the center of the arena during 30 minutes (in 2-min bins) of open-field testing for social/control, short isolation, and long isolation groups on pfd 10, 30, 60, 90, 120, 150, and 180. Mean ± S.E.M. are shown. n = 10–15 fish per treatment group. Compared to social/control fish, fish in long isolation group made more center entries but fish in short isolation group did not.

