
FIGURE 1.
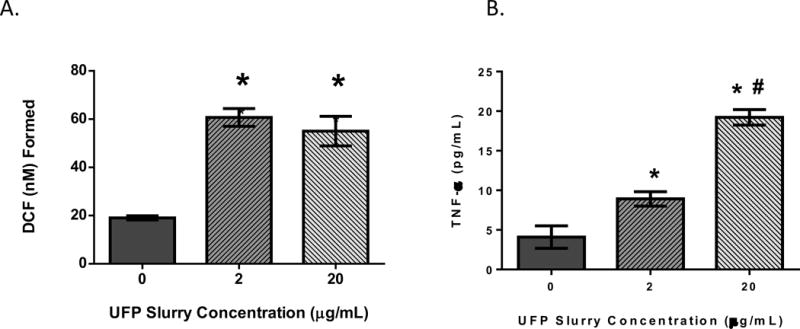
THP-1 cells were treated with 0 (control), 2 or 20μg/mL of UFP. Rate of ROS formation (A) and TNF-α secretion (B) is shown. Data is representative of three experiments conducted on separate days; n=8 biological replicates. * denotes significance p < 0.05 from control group. #: denotes significance p < 0.05 between the 2 & 20μg/mL exposure groups.