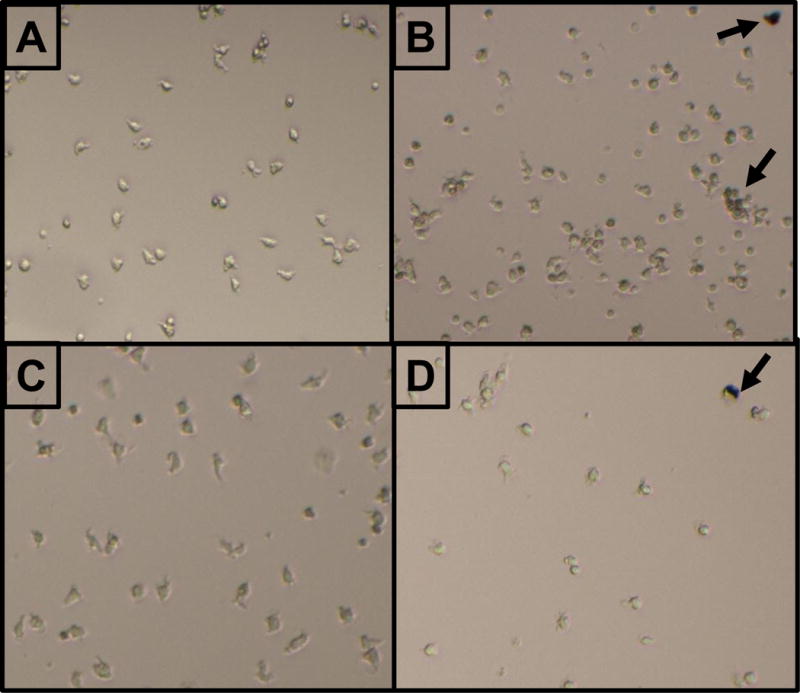
FIGURE 4.

Representative images showing the morphology of primary monocytes derived from the 21yo donor (A & B) or 54yo donor (C & D). Monocytes were exposed to control media (A & C) or 2μg/mL UFP (B & D). Arrow indicates an example of a visible particle agglomerate.
