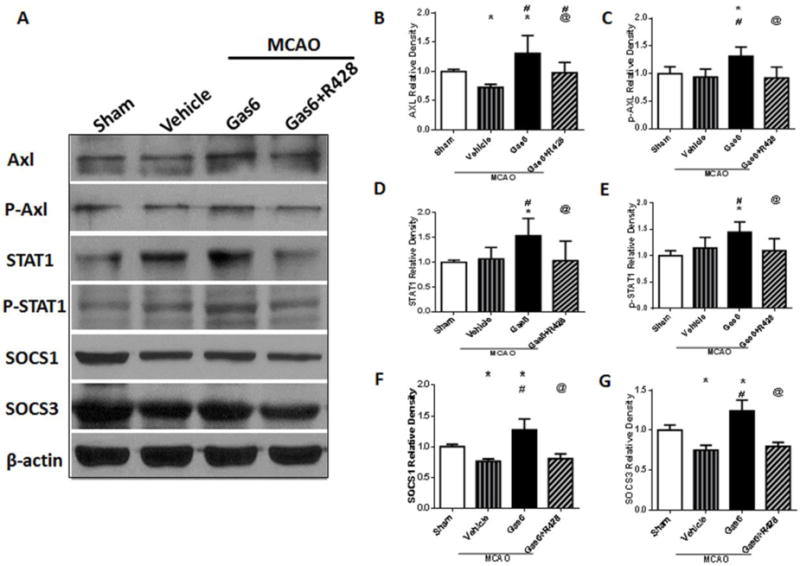
Figure 5.

Changes in expressions of factors and phosphorylation of Axl and STAT1, downstream SOCS1 and SOCS3 after rGas6 treatment at 24 hours after MCAO. (A) The band of Western blot analysis; (B-G) The relative density of Axl, p-Axl, STAT1, p-STAT1, SOCS1, and SOCS3. n=6 for each group. *p<0.05 vs. Sham, #p<0.05 vs. MCAO + Vehicle, and @p<0.05 vs. Gas6 (MD).
