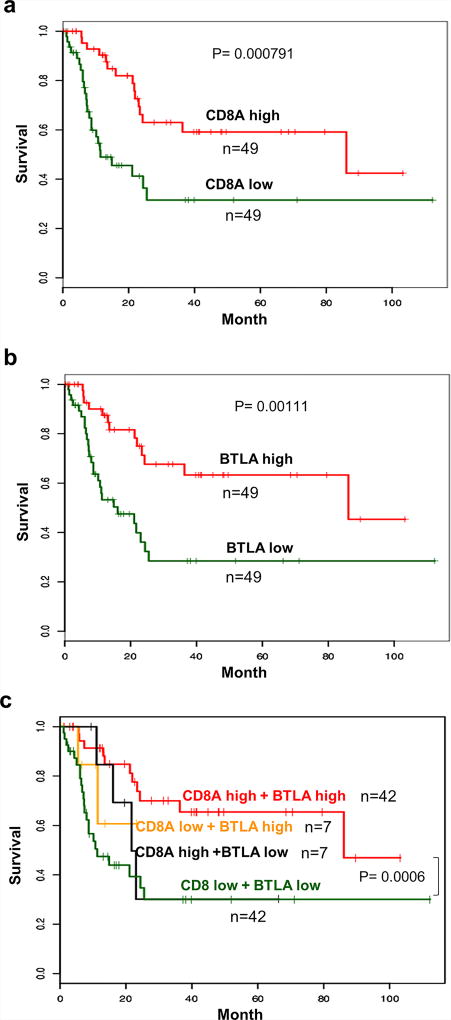
Figure 1. Correlation of BTLA and CD8a co-expression with overall survival in stage III melanoma.
Kaplan-Meier survival curves in stage III metastatic melanoma from The Cancer Genome Atlas (TCGA) consortium depicts; (a) CD8a expression; CD8a high versus CD8a low (b) BTLA expression; BTLA high versus BTLA low (c) Combined CD8 and BTLA expression; CD8a high BTLA high versus CD8a low BTLA high versus CD8a high BTLA low versus CD8a low BTLA low. Total number of patients=98, (high- above median, low-below median). Statistical significance was determined using a log-rank. (P <0.001 and P <0.0001).

