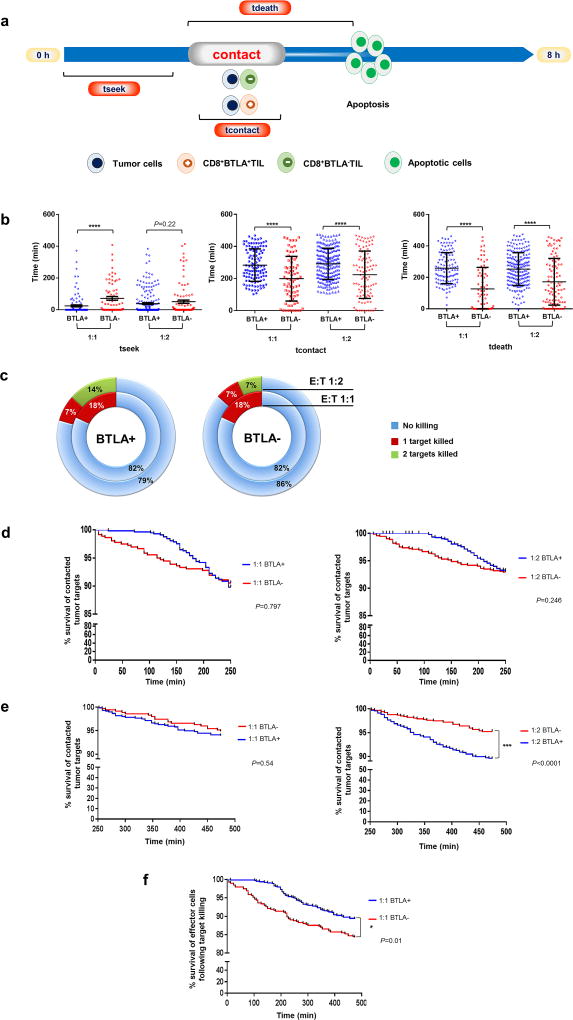
Figure 3. CD8+BTLA+TIL subset mediates killing of multiple tumor targets through enhanced survival properties.
Nanowell array-based cytolysis assay was used to determine tumor killing capacity at single cell level. Effector cell and Tumor target are labeled in different colors and loaded into the nanowell at effector-to-target cell ratios of 1:1 and 1:2. Interaction between effector and target cells is monitored by automated time-lapse camera coupled with a fluorescence microscope. (a) Schematic diagram demonstrates the sequential events that effector cells seek (tseek), contact (tcontact), and mediate tumor cell death (tdeath). (b) Either CD8+MART+BTLA+ or CD8+MART+BTLA− subset was co-incubated with MEL 526. Time (min) between each sequential event is evaluated. Dot plots depict tseek (left), tcontact (middle), tdeath (right) in comparison between CD8+BTLA+ (blue) and CD8+BTLA− (red) subsets. All error bars depicts the mean ± s.e.m. All P-values were calculated using a two-tailed Student’s t-test. (N=497). (c) Donut charts demonstrate the frequency of tumor cell death following effector cell killing by either CD8+BTLA+ (left) or CD8+BTLA− (right) subset. Inner circle and outer circle depict E:T ratio of 1:1 and 1:2 respectively. (d) Kaplan-Meier survival curves of T cell-contacted tumor target resulting in a killing event in the first 250 minutes in comparison between CD8+BTLA+ and CD8+BTLA− subsets at effector-to-target cells ratios of 1:1 (left) and 1:2 (right). (e) Kaplan-Meier survival curves of T cell-contacted tumor target resulting in a killing event in the last 250 minutes minutes in comparison between CD8+BTLA+ and CD8+BTLA− subset at effector-to-target cells ratios of 1:1 (left) and 1:2 (right). Statistical significance in (d) and (e) was determined using a log-rank. (N=3319). (***P <0.0001). (f) Kaplan-Meier survival curves of tumor-contacted effector cells following tumor cell death in comparison between CD8+BTLA+ and CD8+BTLA− subsets at an effector-to-target ratio of 1:1. Statistical significance was determined using a log-rank. (N= 3319) (*P<0.05).

