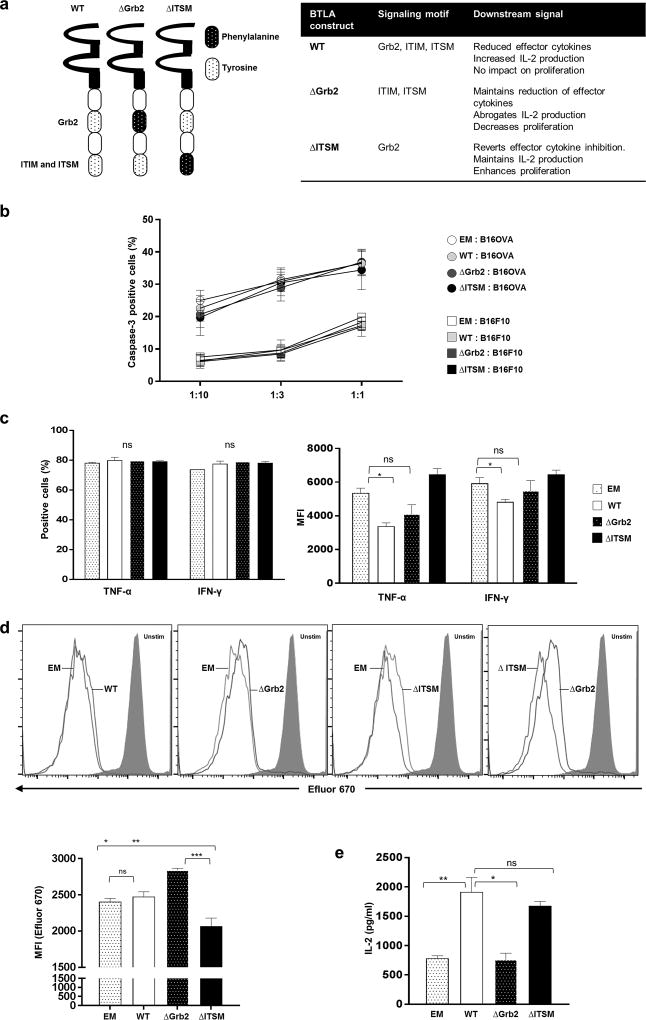
Figure 5. BTLA signaling motifs show no effect on tumor killing, while Grb2 motif augments IL-2 production and T cell proliferation.
(a) Schematic diagram depicts the structure of BTLA WT (left), BTLAΔGrb2 (middle), and BTLAΔITSM (right). Signaling motifs with modified Tyrosine to Phenylalanine are indicated by a dotted pattern over a black background. A table summarizing the phenotype observed with the expression of BTLA or of the different BTLA constructs is presented on the right panel. (b) B16 OVA (mouse melanoma tumor positive for OVA) or B16F10 (mouse melanoma tumor negative for OVA) were stained with eFluor670® and co-cultured with OT-1 BTLA KO T cells overexpressing WT BTLA or BTLA mutants at the following T cell-to-tumor cell ratios (1:10, 1:3, and 1:1). Tumor cell death is depicted by the percentage of caspase-3 positive cells. N=3 independent experiments (c) OT-1 BTLA KO T cells overexpressing WT BTLA or its variants were re-stimulated with dendritic cells pulsed with OVA peptide. TNF-α and IFN-γ production by virally transduced OT-1 BTLA KO T cells was evaluated by intracellular staining. Bar graph depicts the percentage of positive cells (left panel) and mean fluorescence intensity (MFI) (right panel). Each bar represents three independent experiments. (Two-way ANOVA; *P<0.05). (d) OT-1 BTLA KO T cells overexpressing WT BTLA or its variants were labeled with eFluor670® and re-stimulated with dendritic cells pulsed with OVA peptide. Cell proliferation was determined by the dilution of eFluor670®. Histogram plots of eFluor670® demonstrate proliferation of OT-1 BTLA KO T cells overexpressing WT BTLA or its variants. Bar graph depicts MFI of virally transduced T cells in the same experiment shown in the left panel. N=3 *P <0.05, **P <0.001, ***P<0.0001. All error bars depicts the mean ± s.e.m. All P-values were calculated using a two-tailed Student’s t-test. (e) Virally transduced OT-1 BTLA KO T cells were stimulated with plate-bound anti-mouse CD3 and HVEM Fc. Supernatants were assessed for IL-2 production using by MILLIPLEX MAP Mouse CD8+ T Cell Magnetic Bead Panel Assays. Each bar graph represents two independent experiments. *P <0.05, **P <0.001. All error bars depicts the mean ± s.e.m. All P-value were calculated using a two-tailed Student’s t-test.

