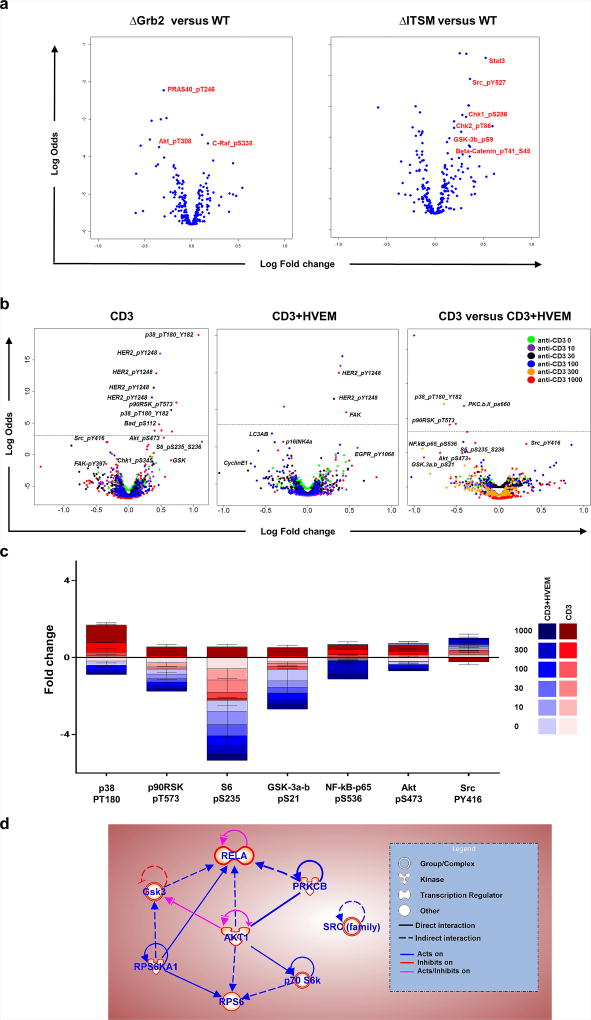
Figure 6. BTLA-HVEM signaling axis suppresses MAPK, Akt, and NF-κB pathways, but selectively augments the Src pathway.
(a) OT-1 BTLA KO T cells overexpressing WT BTLA or its variants were re-stimulated with plate-bound anti-CD3 and HVEM-Fc for 8 h prior to harvest. Cells were lysed and the protein supernatant was collected to perform RPPA. Volcano plots depict fold change of proteins with the following comparisons: ΔGrb2 versus WT (left), ΔITSM versus WT (middle), and ΔITSM versus EM (right). Data shown represent two independent experiments. P <0.05. P-values were calculated using Linear models and empirical Bayes methods. (b and c) Sorted CD8+BTLA+ TIL were stimulated with plate-bound anti-CD3 (0, 10, 30, 100, 300, and 1000 ng/ml) alone or with HVEM-Fc for 8 h prior to harvest. Cells were lysed and the protein supernatant was collected to perform RPPA. (b) Volcano plot depicts fold change of proteins in CD8+BTLA+TIL upon T cell activation with anti-CD3 alone (left), anti-CD3 + HVEM (middle), and anti-CD3 in comparison with anti-CD3 + HVEM (right). (c) Bar graph demonstrates proteins that significantly change in comparison between anti-CD3 activation alone (red) and anti-CD3 + HVEM ligation (blue). (d) Signaling network from the proteins that significantly change in (c) were clustered by Ingenuity Pathway Analysis. N=5, P <0.05. P-values were calculated using Linear models and empirical Bayes methods.

