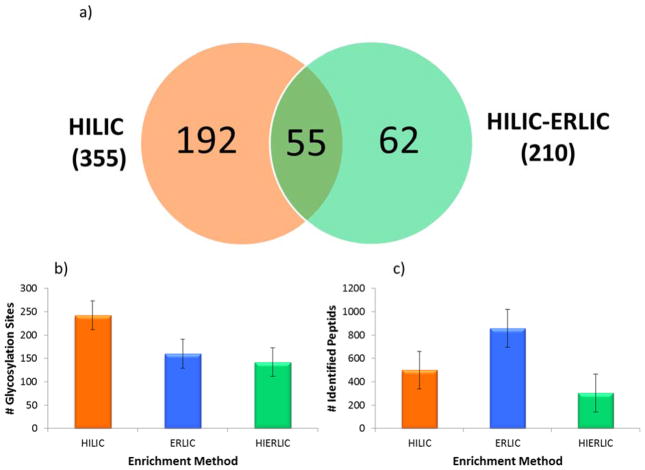
Figure 3.
Enrichment Method Comparison. HILIC, ERLIC, and sequential HILIC-ERLIC enrichment methods were compared using cell line CRL-1620. The Venn diagram (a) depicts the number of identified unique glycosylation sites for HILIC and HILIC-ERLIC enrichment methods (shown bolded in the parentheses is the total number of glycopeptides identified in each case) and of those, which glycosylation sites were unique to the individual methods. The two graphs compare the average number of glycosylation sites (b) to the number of identified peptides (c). 242 glycosylation sites, the largest amount, were detected with HILIC enrichment and that 142 peptides, the lowest amount, were determined from HILIC-ERLIC enrichment. The error bars represent the standard deviations associated with biological triplicates.

