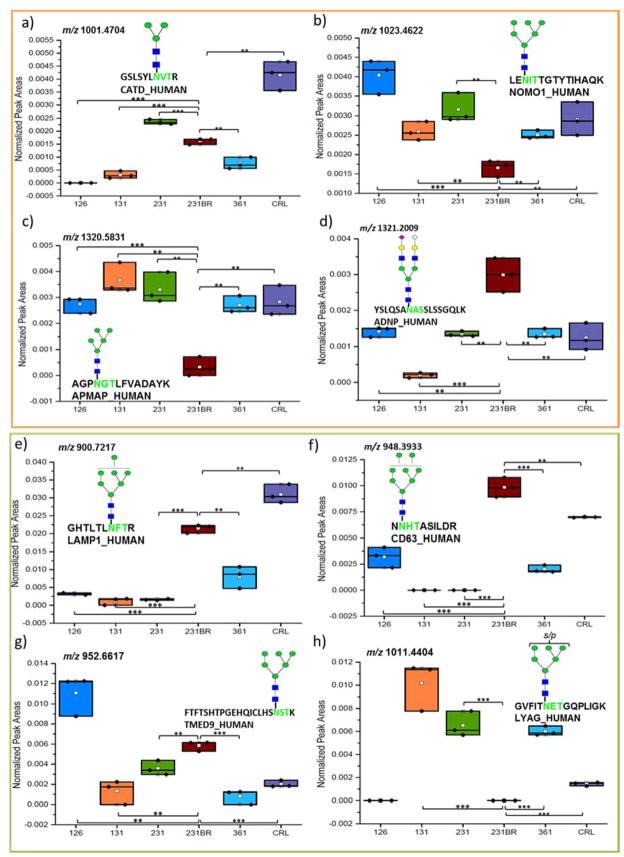
Figure 5.
Box and dot plots of normalized peak areas of glycopeptides identified by LC-MS/MS after HILIC (a) and HILIC-ERLIC (b) enrichment. These glycopeptides were determined to have statistically significant differences in expression when compared to cell line 231BR. Symbols are the same as in Figure 5; *p < 0.05, **p < 0.01, and ***p < 0.001 (Student’s t-test).

