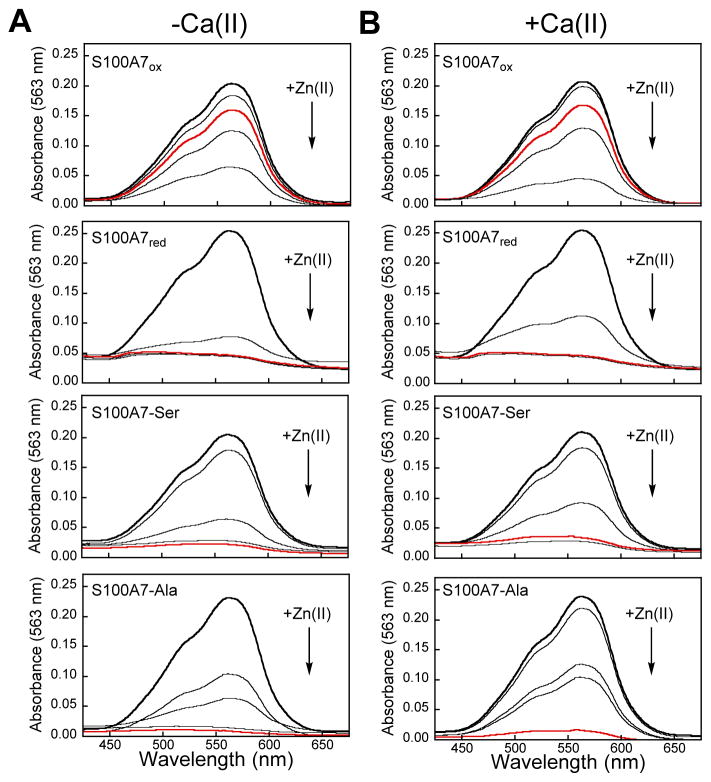
Figure 12.
Optical absorption spectra showing the substitution of Co(II) for Zn(II) at the His3Asp sites of S100A7 in the absence (A) and presence (B) of 2 mM Ca(II). Black trace: spectrum of S100A7 (400 μM) in the presence of Co(II) (1.6 mM, 4.0 equiv) at pH 7.0 (75 mM HEPES, 100 mM NaCl, ±2 mM Ca(II)). Additional traces: after 1.6 mM Zn(II) was added to the sample. For S100A7ox, time points were collected at 5, 60, 360, and 2400 min. For S100A7red, S100A7-Ser and S100A7-Ala, time points were collected at 5, 20, 30 and 60 min. For all proteins, the spectrum collected at the 60 min time point is shown in red.

