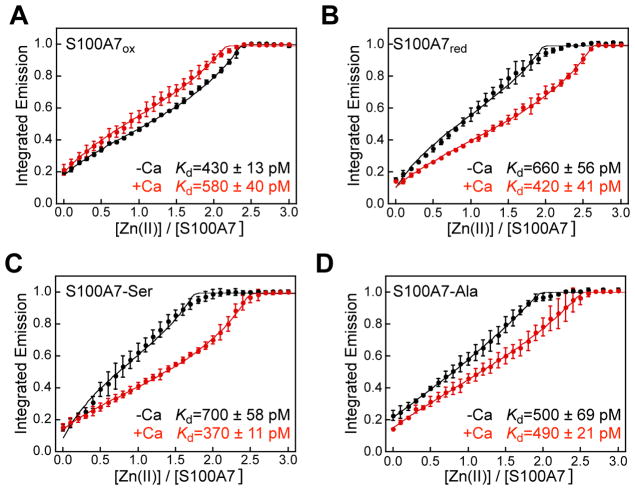
Figure 7.
Zn(II)-induced response of 2 μM ZP4 in the presence of 5 μM (A) S100A7ox, (B) S100A7red, (C) S100A7-Ser, and (D) S100A7-Ala at pH 7.0 (75 mM HEPES, 100 mM NaCl) at 25 °C, in the absence (black circles) and presence (red circles) of 100 equiv of Ca(II). Excitation was provided at 495 nm and the emission spectra were integrated from 505–650 nm. The integrated emission was normalized to the maximum response (mean ± SDM, n = 3). The data were fit to a two-sites binding model with Kd1 = Kd2. The calculated apparent Kd values corresponding to the fits are listed in the bottom right of each plot.

