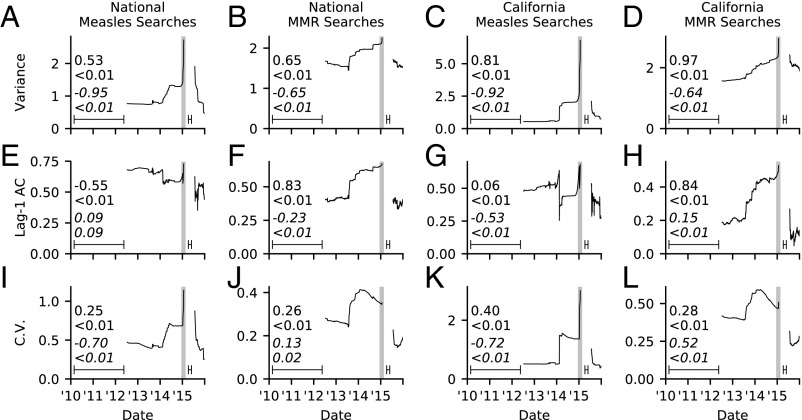
Fig. 5.
CSD in GT search index before and after Disneyland measles outbreak. (A–D) Variance, (E–H) lag-1 AC, and (I–L) coefficient of variation for (A, E, and I) US searches for measles, (B, F, and J) US searches for MMR, (C, G, and K) California searches for measles, and (D, H, and L) California searches for MMR. The residual time series was used for variance and lag-1 AC. Kendall tau rank correlation coefficients are displayed before (regular font) and after (italic) the Disneyland peak with P values denoted by <. Window width used to compute rolling averages is indicated by line interval. Shaded region indicates outbreak time period. See Methods and SI Appendix, section S4 for details.

