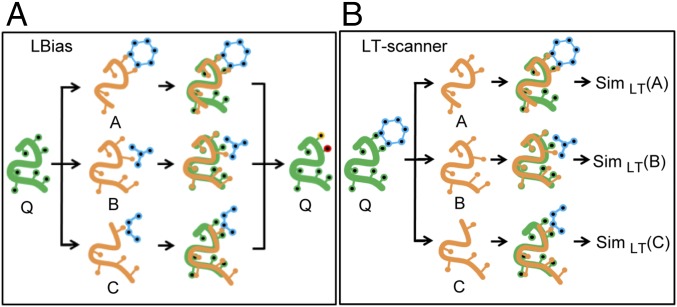
Fig. 1.
Overview of LBias and LT-scanner methods. (A) For a given query protein (shown in green) LBias collects and superposes structure neighbors A, B, and C (shown in yellow) that are cocrystalized with their bound ligands (shown in blue). Then LBias predicts the most likely ligand-binding residues (shown in red and yellow) on the query protein based on collective contact information that the superposed ligands make. (B) For a given template cocrystal structure of a drug (shown in blue) and a template protein (shown in green), LT-scanner scans through protein A, B, and C (shown in orange) for by superposing the template structure onto each protein so as to create interaction models. Then LT-scanner calculates the SimLT-scanner interaction similarity score (shown as SimLT) between the interaction models of the query–drug complex and the interactions in the binding site of the template.

