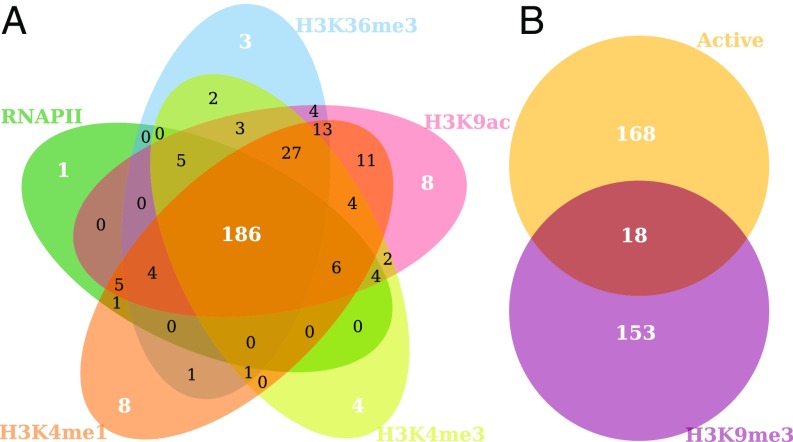
Fig. 3.
Classification of intermingling regions into active and inactive clusters. (A) Five-way Venn diagram representing the number of clusters enriched for each active epigenetic mark and RNAPII. Interestingly, many clusters (186 of 446) are enriched for all five active marks. (B) Venn diagram of the active clusters (the 186 clusters in the intersection of the five-way diagram in A) and clusters enriched for the silencing mark H3K9me3. Note that only 18 of 446 clusters are both active and silenced, showing that the clusters separate into two categories of active and inactive clusters.

