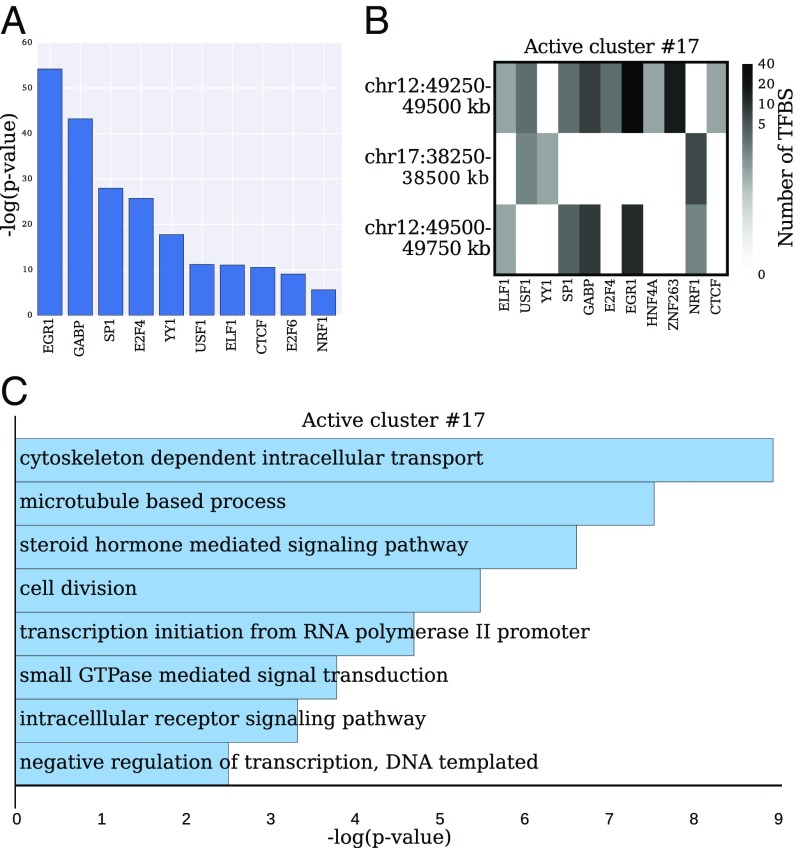
Fig. 4.
TFBS and GO terms across active clusters. (A) Top 10 TFs with significantly overrepresented TFBS in active clusters compared with the whole-genome distribution (under a Mann–Whitney U test). (B) Matrix corresponding to a representative active cluster with the number of TFBS for each 250-kb region in the cluster. Only TFs containing at least one nonzero column entry are shown. A TF shared among multiple regions in the cluster may indicate its role in colocalization and coregulation of the clustered regions. (C) Significantly enriched GO terms computed from the genes that are expressed and colocalized in the intermingling cluster shown in B [ranked by P value using DAVID, SI Appendix].

