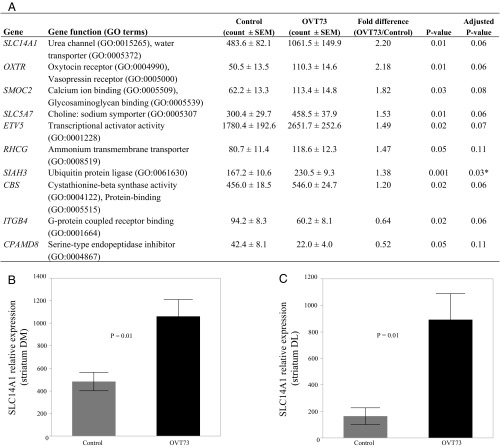
Fig. 1.
Urea transporter transcripts are elevated in OVT73 striatum. NanoString nCounter quantification of 24 target genes identified in RNA-seq analysis confirmed that 10 transcripts were altered in OVT73 striatum compared with control (P < 0.05; two-way Student’s t test). (A) Mean normalized counts ± SEM for control (n = 6) and OVT73 (n = 6), fold difference (OVT73/control), and P values (nonadjusted and false discovery rate adjusted using the Benjamini–Hochberg technique) are shown for each of the 10 validated transcripts, quantified in RNA from anterior striatum (DM portion). *P < 0.05 after false discovery rate adjustment. Key Gene Ontology (GO) terms are shown for each gene (www.geneontology.org/). Bar graphs depicting SLC14A1 expression in the DM (B) and DL (C) portions of anterior striatum are shown (±SEM). Transcript counts were normalized to the geometric mean of four reference genes: CANX, SHMT2, TRIM27, and TRIP11.

