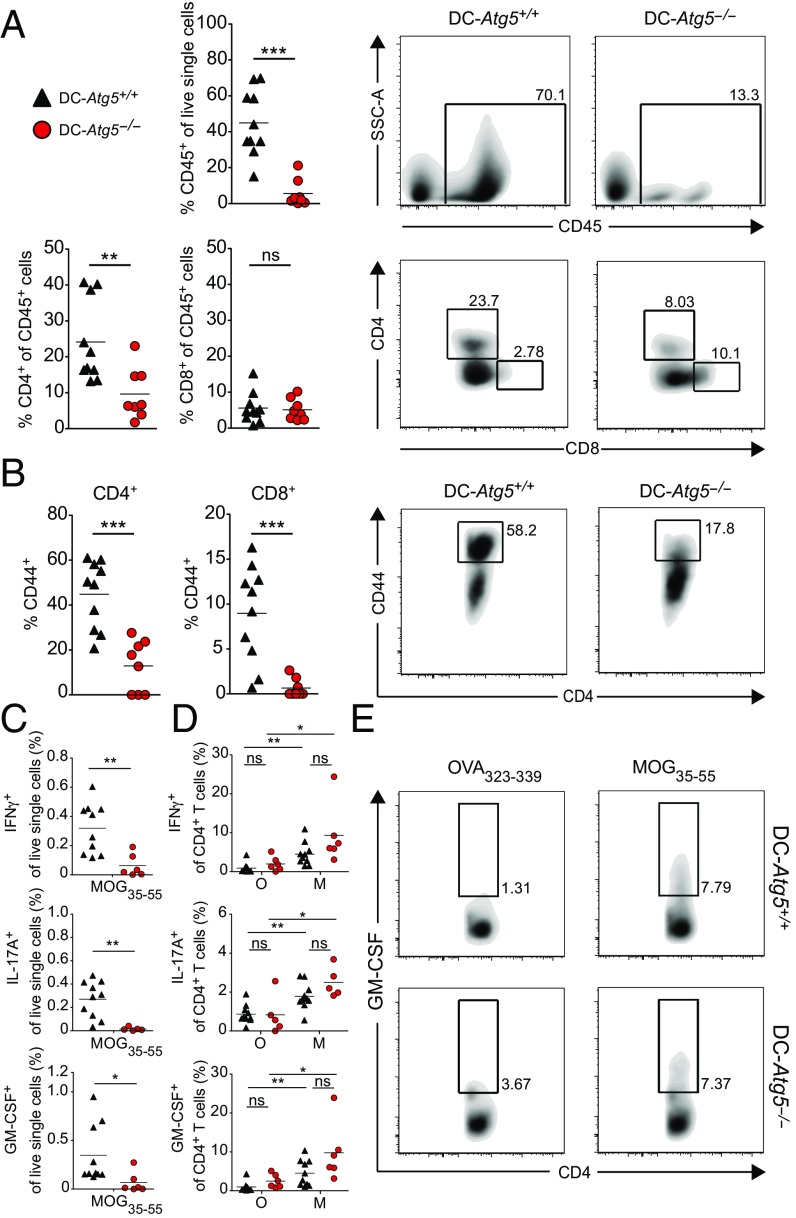
Fig. 3.
Lack of ATG5 in CD11c+ DCs limits accumulation of encephalitogenic CD4+ T cells within the CNS. (A) Twenty-one days (±1) after adoptive transfer EAE induction, DC-Atg5−/− mice exhibit significantly fewer CD45+ infiltrates in the CNS. Furthermore, quantification of immune cell subsets shows significantly lower proportions of CD4+ T cells in DC-Atg5−/− compared with DC-Atg5+/+ mice at the peak of disease in the CNS, whereas no difference is observed in the CD8+ T cell compartment. (B) At the peak of disease, DC-Atg5−/− mice exhibit significantly lower frequencies of activated CD44+/CD4+ and CD8+ T cells in the CNS. (C) The ability of CNS-invading CD4+ T cells to produce proinflammatory cytokines was determined. Leukocytes were isolated and purified from the CNS at the peak of disease (day 21 ± 1). For each animal the CNS-derived cell suspension was divided into two groups, and cells were restimulated for 4 h with either MOG35–55 peptide (M) or OVA323–339 peptide (O). CNS-infiltrating CD4+ T cells in DC-Atg5−/− mice maintain their capacity to produce effector cytokines. DC-Atg5+/+ mice contain significantly more (percentage of live single cells) cytokine-producing MOG35–55–specific CD4+ T cells in the CNS than DC-Atg−/− mice. (D) Both DC-Atg5−/−– and DC-Atg5+/+–derived CD4+ T cells are capable of secreting cytokines (IFNγ, IL-17A, and GM-CSF) upon restimulation with MOG35–55 (but not with OVA323–339) to similar degrees. (E) Representative density plot for GM-CSF+ CD4+ T cells in the CNS of DC-Atg5−/− or DC-Atg5+/+ mice at the peak of disease. Pooled data of two independent experiments are shown. Statistical analysis: Mean is depicted. Unpaired two-tailed Student t test was applied. ns, not significant: P > 0.05; *P < 0.05, **P < 0.01, ***P < 0.001.

