Fig. 1.
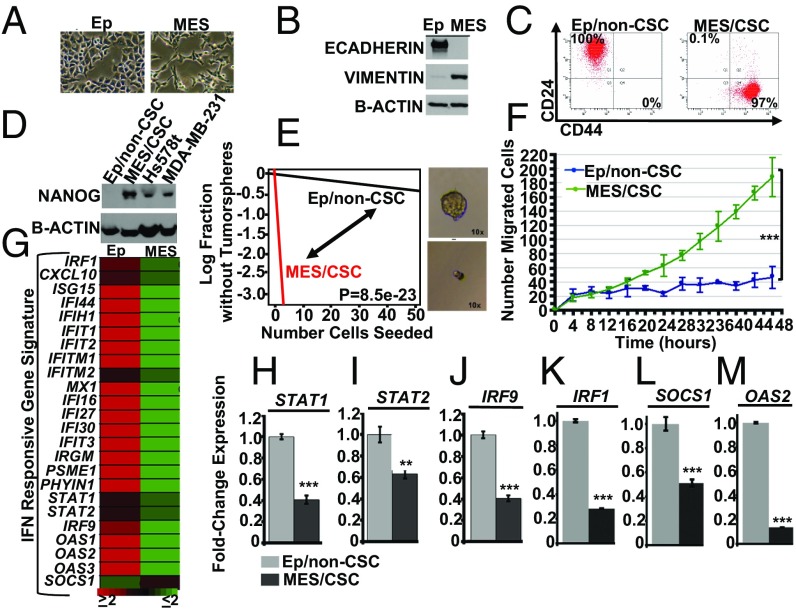
IFN-stimulated genes (ISGs) are repressed in mesenchymal/CSCs. (A) Transformed HMECs consist of two subpopulations, epithelial cells (epithelial morphology) and mesenchymal cells (mesenchymal morphology), as determined by bright field microscopy (10×). (B) Epithelial cells express E-CADHERIN, while mesenchymal cells express VIMENTIN, as determined by Western analysis. (C) Epithelial cells are characterized by a CD24Lo/CD44Hi cell surface profile, while mesenchymal cells are characterized by CD24LO/CD44HI profile, as determined by flow cytometry. (D) Mesenchymal cells express the pluripotent stem cell transcription factor, NANOG, relative to epithelial cells, as shown by Western analysis. Hs578t and MDA-MB-231 are TNBC cell lines used as positive controls. Mesenchymal cells (E) form robust tumor spheres at limiting dilution (stem cell frequency; P = 8.5e-23; n = 3) and (F) show enhanced migration in a cell motility assay (two-tailed t test, ***P < 0.001, n = 3). (G) An IFN-responsive gene signature derived from our previous publications (18, 19) shows ISGs (STAT1, STAT2, IRF9, IRF1, SOCS1, and OAS2) are repressed at least twofold in Mes/CSCs relative to Ep/non-CSCs, as determined by microarray analysis. (H–M) ISGs (STAT1, STAT2, IRF9, IRF1, SOCS1, and OAS2) are repressed in Mes/CSCs relative to Ep/non-CSCs, as determined by qRT-PCR. Data represent mean fold-changes ± SEM, n = 3 (**P < 0.01, ***P < 0.001).

