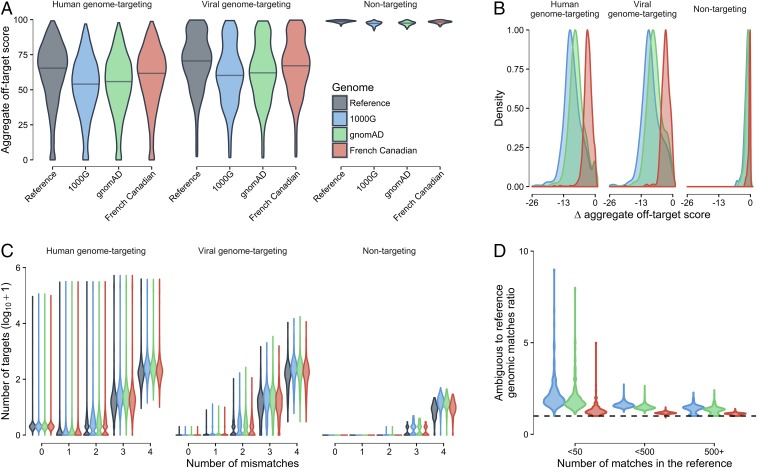
Fig. 1.
Off-target scores using the ambiguous genome approach. (A) Distribution of aggregate off-target scores in the reference and ambiguous genomes for human-genome–targeting, viral-genome–targeting, and nontargeting gRNAs. (B) Change in aggregate off-target score between ambiguous and reference genomes. (C) Distribution of off-target sites by number of mismatches. (D) Ratio of the number of off-target sites in ambiguous genomes compared with the reference genome stratified by the number of off-target sites in the reference genome. The y axis shows the ratios for each gRNA, whereas the x axis shows the number of off-target sites in the reference genome.

