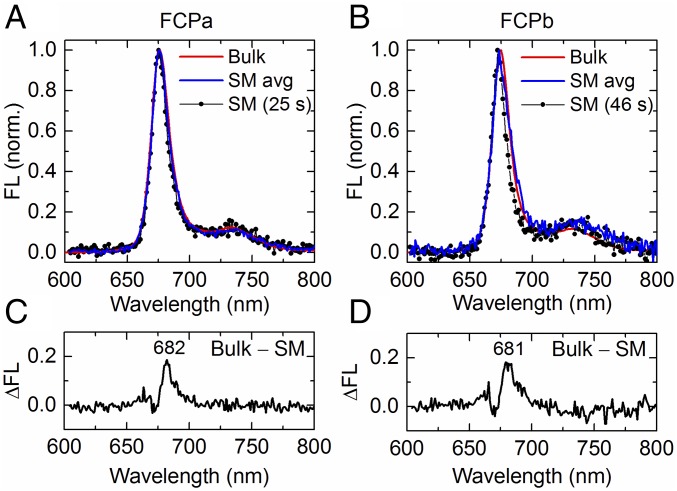
Fig. 1.
Comparison between bulk and representative single-molecule (SM) fluorescence (FL) spectra. (A) Spectrum of a single FCPa complex, measured continuously for 25 s (SM, black); average of all FCPa SM spectra (blue) from a dataset containing 2% stable 680-nm spectra; room-temperature (RT) bulk spectrum of FCPa complexes at an OD of 0.03 (red). (B) Same as A, but for FCPb. The SM spectrum (black) was acquired during 46 s, while the population-averaged spectrum (blue) corresponds to a dataset containing 18% complexes exhibiting stable 680-nm spectra. (C and D) Difference between the bulk and SM spectrum in A and B, respectively. The peak wavelength is indicated.

