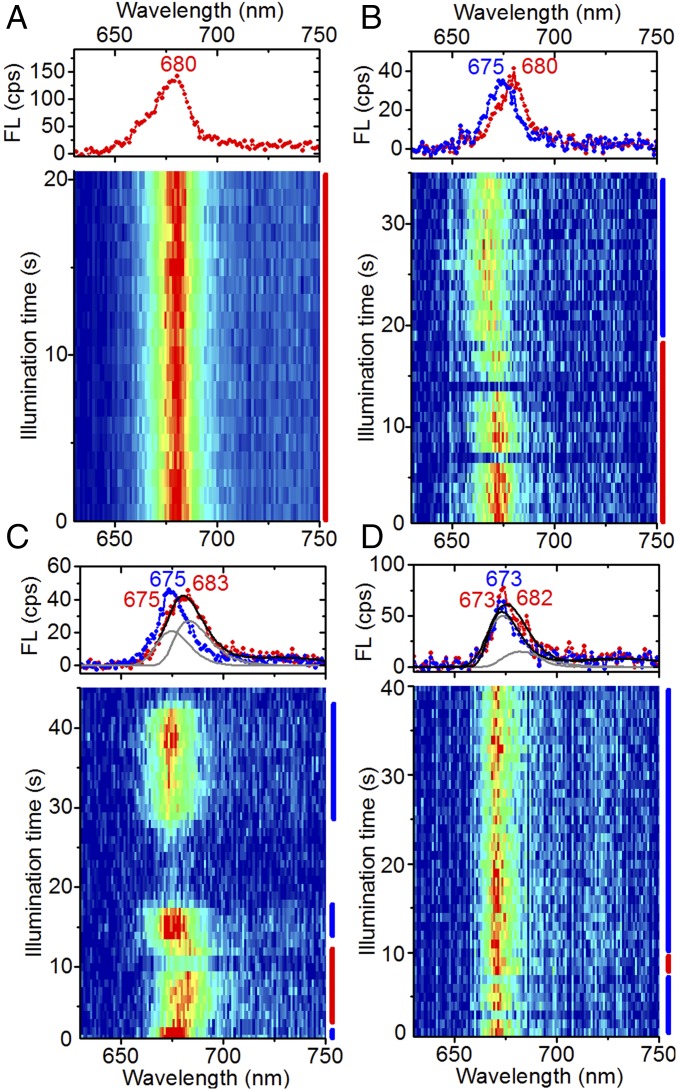
Fig. 2.
Representative spectral sequences from individual FCP complexes displaying spectral dynamics near 680 nm. (A) Example of stable emission at 680 nm. (B–D) Reversible switches into emission states containing a significant fraction of emission near 680 nm. Counts were integrated into 1-s bins. Spectra on Top denote different stages of spectral evolution of the fluorescence (FL) emission, averaged over the times indicated by the bars with corresponding color on the Right. Peak positions (in nanometers) of resolved spectral bands (gray lines) are indicated on Top, with the color matching the corresponding spectrum. Double-band fits (thick black lines) were performed by maintaining the peak position and width of the single-band spectra (blue) in the same sequence. Large intensity variations are due to fluorescence blinking. A and D were obtained from FCPb, and B and C from FCPa.

