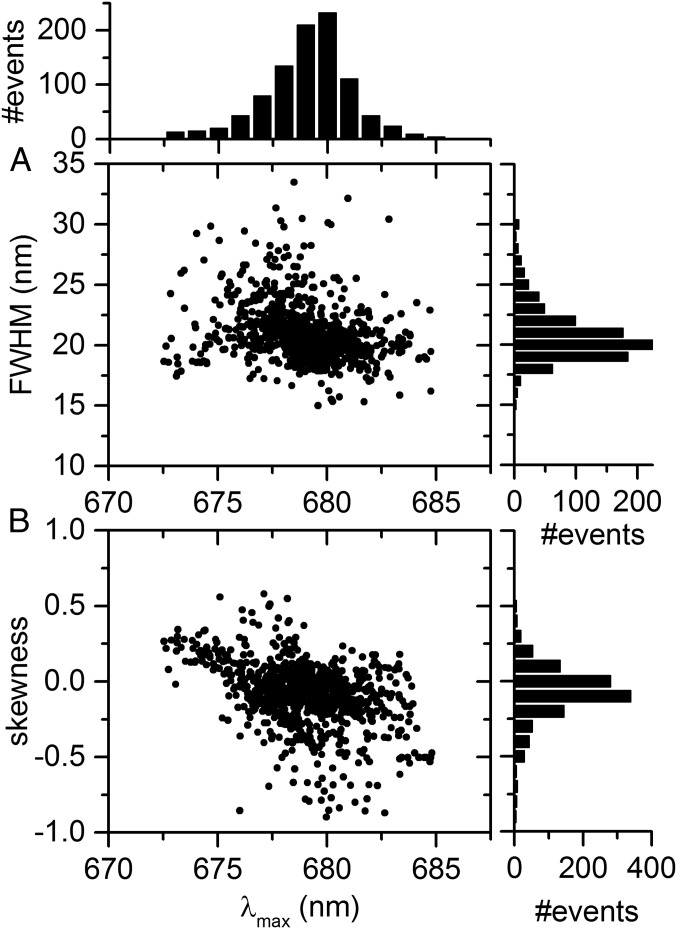
Fig. 4.
Spectral properties of 680-nm emission. (A) Distribution of full width at half-maximum (FWHM) vs. spectral peak position (λmax) of 940 spectra from 80 individually measured FCPb complexes exhibiting substantial emission near 680 nm. Each spectrum was fitted separately using single-skewed Gaussian functions. Histograms of λmax and FWHM are shown on Top and on the Right, respectively, using 1-nm bins. (B) Skewness of single-skewed Gaussian fit vs. spectral peak position corresponding to data in A, using bins of 0.1 on the vertical.

