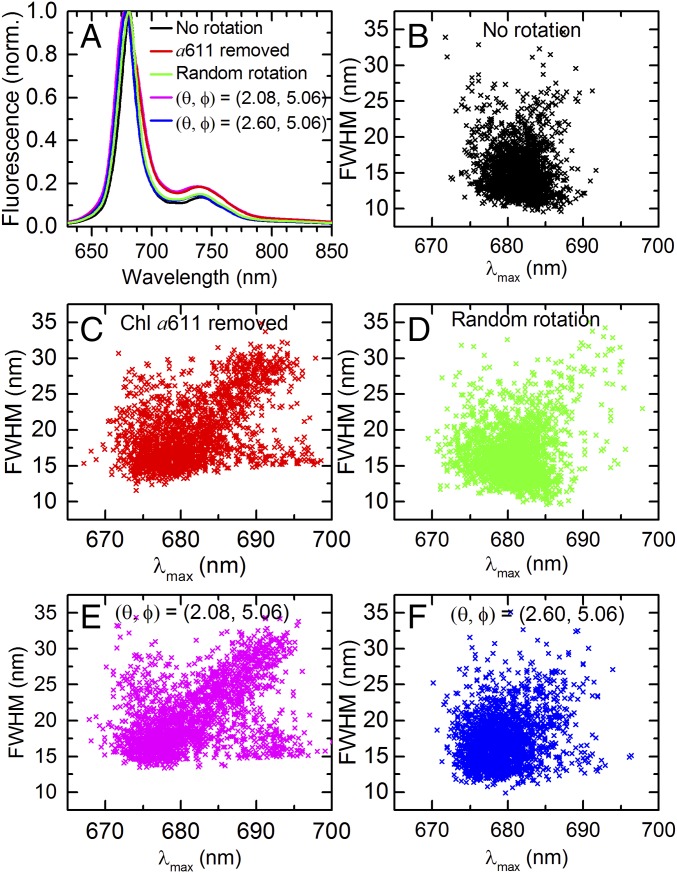
Fig. 6.
Simulated spectral properties. (A) Modeled fluorescence spectra of LHCII with different modifications with respect to Chl a611, compared with the intact complex (black). Each spectrum denotes the average over 2,000 realizations of the disorder, and the green spectrum also includes the average over all orientations of a611. The magenta and blue spectra correspond to an orientation of the Qy transition dipole moment of Chl a611 in spherical coordinates of (θ, Φ) = (2.08, 5.06) rad and (θ, Φ) = (2.6, 5.06) rad, respectively. For intact LHCII (black), this orientation is (θ, Φ) = (3.078, 5.06) rad. (B–F) Simulated distributions of FWHM vs. peak position corresponding to the color-coded spectra in A. Each data point represents a different realization of the disorder. Each data point in D represents an average over all orientations.

