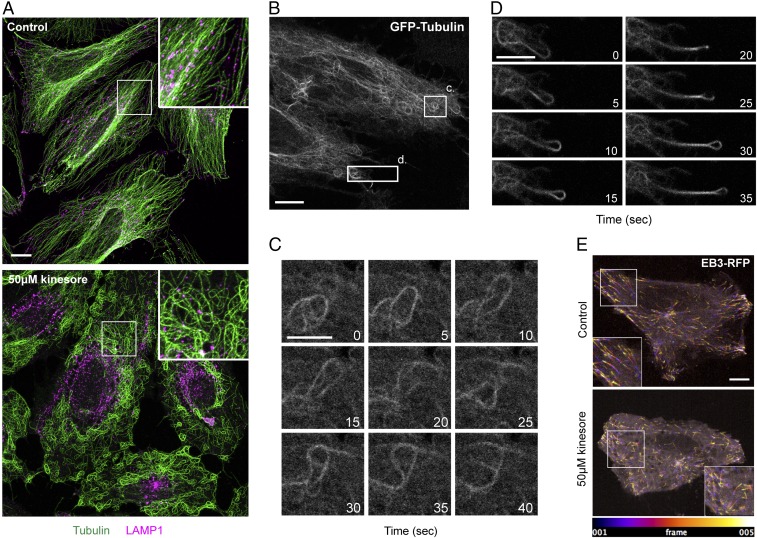
Fig. 2.
Kinesore induces the remodeling of the microtubule network. (A) Representative maximum-intensity projection immunofluorescence images acquired using a Ziess 880 Airyscan microscope of HeLa cells treated with 50 μM kinesore or vehicle control (0.1% DMSO) for 1 h. Cells were immunostained for β-tubulin (green) and LAMP1 (magenta). (Scale bar in A, 10 μm. Enlargement magnification: 2.6×.) (B–D) Stills derived from Movie S1 showing representative dynamics of GFP-tubulin in live HeLa cells treated with 50 μM kinesore for 1 h. Numbering denotes time in seconds from start of the still sequence. (Scale bars: B, 10 μm; C and D, 5 μm.) (E) Pseudocolored spinning-disk confocal microscopy projection images from the first five frames (20 s) of Movies S2 and S3, showing dynamics of EB3-RFP in control and kinesore-treated HeLa cells. (Scale bar in E: 10 μm. Enlargement magnification: 1.5×.)

