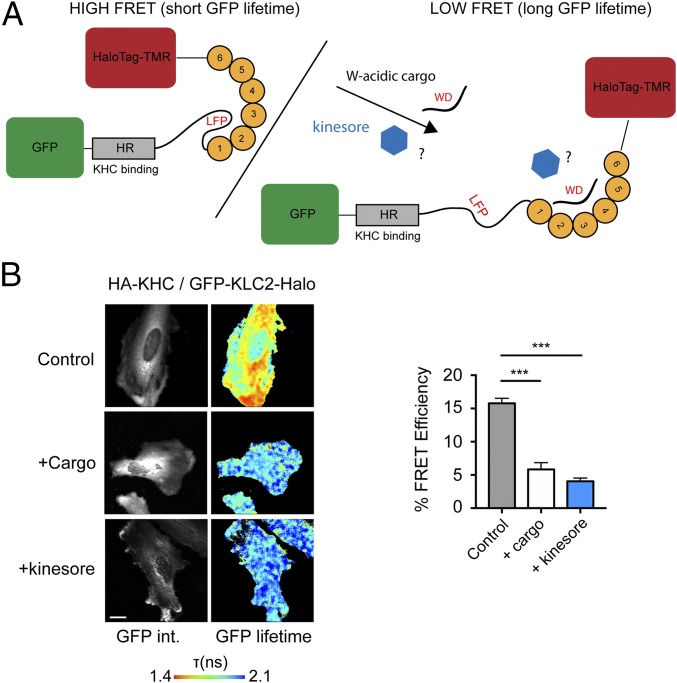
Fig. 4.
Kinesore induces the cargo-driven KLC conformational switch. (A) Schematic showing KLC2 FRET biosensor with an N-terminal eGFP and a C-terminal HaloTag that allows covalent coupling of TMR. (Left) The autoinhibitory interaction mediated by the light chain LFP motif is indicated (25). (Right) A representation of the change in conformation to the low FRET state induced by the coexpression of the W-acidic cargo CSTN1. (B) Multiphoton fluorescent lifetime images of FRET between GFP and TMR-HaloTag in cells transfected with HA-KHC and GFP-KLC2-Halo biosensor and either cotransfected with CSTN (879–971) (cargo) or treated with 50 μM kinesore for 1 h. “GFP int.” are multiphoton GFP intensity images, whereas lifetime image refers to the fluorescence lifetime of GFP (τ) and is represented by a pseudocolor scale. In these images, a reduction in lifetime (change in color from blue to red) indicates FRET and therefore close association of GFP and TMR-HaloTag. Graphs show data from 12 cells from two independent experiments expressed as FRET efficiency. (Scale bar, 10 μm.) FRET is significantly reduced by either cargo cotransfection or 1-h kinesore treatment. Error bars are ± SEM ,***P < 0.001 determined using one-way ANOVA and comparing to control.

