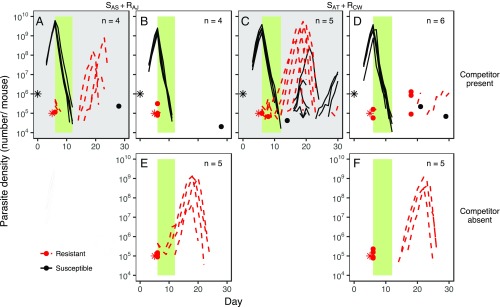
Fig. 4.
Resource limitation prevents the emergence of drug-resistant parasites, irrespective of the combination of strains with which the host is infected. Dynamics of susceptible (black, solid lines) and pyrimethamine-resistant (red, dashed lines) parasites in mice coinfected with SAS and RAJ (A and B), SAT and RCW (C and D), or only RAJ (E) or RCW (F), and either administered resources (A and C; gray background) or not (B and D–F; white background) are shown. The resistant strains (RAJ and RCW), but not the susceptible strains (SAS and SAT), possess the mutation associated with pyrimethamine resistance in this system (Fig. S7). Each line represents the dynamics of infections in an individual mouse; the infection dynamics of each mouse are plotted separately in Fig. S9. Stars represent the number of parasites inoculated and the time at which they were administered. Dots indicate the density of parasites detected on a particular day in instances where parasites were not detected the day before or after. The green bar indicates the duration and timing of pyrimethamine treatment. n, number of mice plotted and included in the analysis. Note that in these experiments, unlike those in Fig. 2, resistant parasites were not grown alone in pABA-supplemented mice.

