Fig. 1.
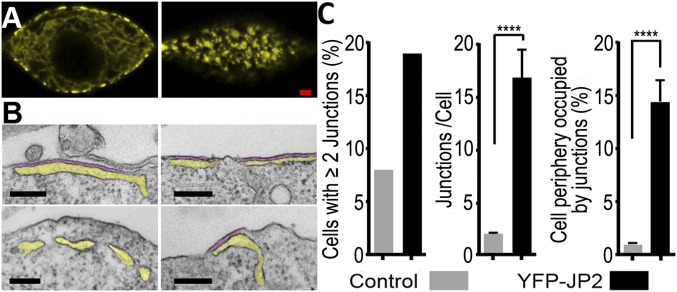
Expression of YFP–JP2 induces the formation of extensive ER–PM junctions in tsA201 cells. (A) Midlevel (Left) and surface (Right) confocal sections of a transiently transfected tsA201 cell reveal clustering of YFP–JP2 at the cell periphery. (Scale bar, 2 µm.) (B) Thin-section electron micrographs reveal that the peripherally clustered YFP–JP2 likely corresponds to ER–PM junctions. Representative images are shown of cells transfected with YFP–JP2 (Upper) or nontransfected cells (Lower) with yellow and purple shading to indicate ER lumen and junctional gap, respectively. (Scale bars, 200 nm.) (C) Quantitative morphometry reveals that transfection increased the fraction of cells displaying ER–PM junctions, the average length of the junctions, and the percentage of the cellular periphery occupied by those junctions. Transfection efficiency was ∼20%, and the analysis of junctions per cell and percentage of cellular periphery occupied were carried out for cells with two or more junctions (Table S1). Based on Welch’s adjusted t test, the bracketed values were significantly different. ****P < 0.0001.

