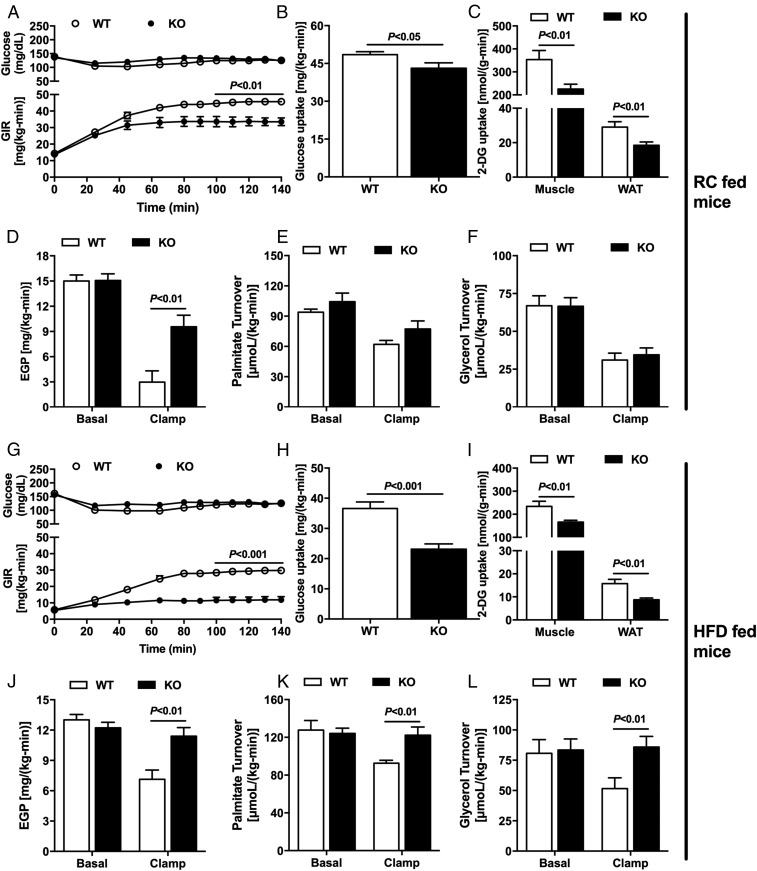
Fig. 1.
Nat1 KO mice display insulin resistance in liver, muscle, and WAT, which was exacerbated by HFD. Time-course of plasma glucose and glucose infusion rates (GIR) (A) during the hyperinsulinemic-euglycemic clamp of WT and Nat1 KO mice fed RC. (B) Whole-body insulin-stimulated glucose uptake. (C) Insulin-stimulated skeletal muscle and WAT 2-deoxy-glucose uptake. (D) Basal and clamp endogenous glucose production. (E) Basal and clamp palmitate turnover. (F) Basal and clamp glycerol turnover. (G) Time-course of plasma glucose and GIR during the hyperinsulinemic-euglycemic clamp of WT and Nat1 KO mice fed a HFD. (H) Whole-body insulin-stimulated glucose uptake. (I) Insulin-stimulated skeletal muscle and WAT 2-deoxy-glucose uptake. (J) Basal and clamp endogenous glucose production. (K) Basal and clamp palmitate turnover. (L) Basal and clamp glycerol turnover. Data are represented as mean ± SEM (n = 10 per group).

