Fig. 2.
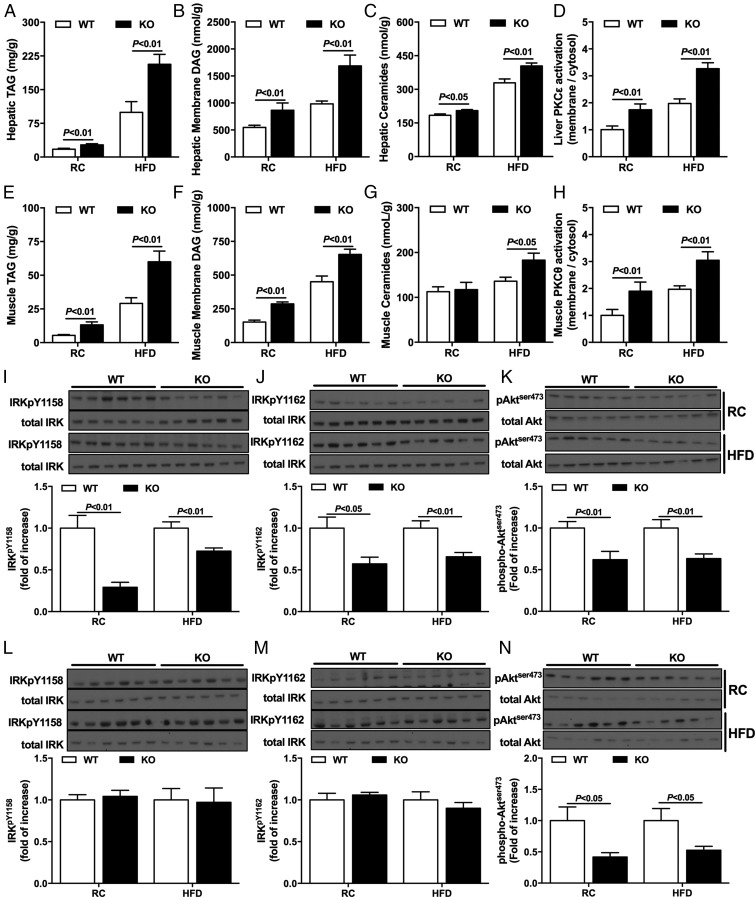
Nat1 KO mice display increased ectopic lipid content and reduced insulin signaling in liver and skeletal muscle. Hepatic TAG (A), hepatic membrane DAG (B), and hepatic ceramides (C) content in WT and KO mice fed either RC or a HFD. Hepatic PKCε activation (D) in WT and KO mice fed either RC or a HFD. Muscle TAG (E), muscle membrane DAG (F), and muscle ceramides (G) content in WT and KO mice fed either RC or a HFD. Muscle PKCθ activation (H) in WT and KO mice fed either RC or a HFD. Western blot images and quantification for insulin-stimulated IRK phosphorylation pY1158 (I) and pY1162 (J), and Akt phosphorylation (K) in liver. Western blot images and quantification for insulin-stimulated IRK phosphorylation pY1158 (L) and pY1162 (M) and Akt phosphorylation (N) in muscle. Data are represented as mean ± SEM (n = 8–12 per group).

