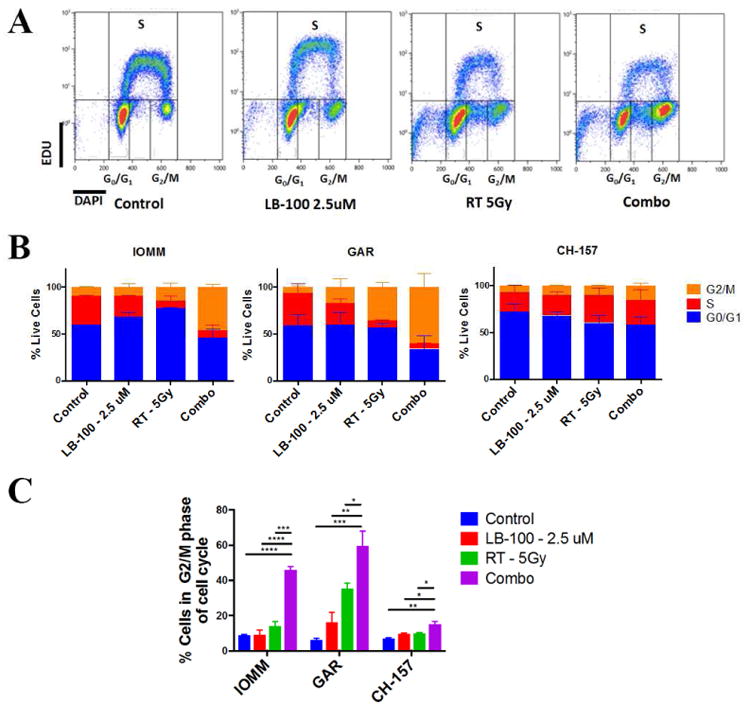
Figure 4.

LB-100 and radiation induced accumulation of G2/M phase of cell cycle. (A) Cell cycle analysis using flow cytometry was performed to determine the relative percentages of IOMM-LEE, GAR and CH-157 cells in G0/G1, S and G2/M phased of cell cycle using EDU and DAPI staining 48 hours after treatment. LB-100 was given 3 hours prior to RT. Representative FACS plots were shown. (B) Quantification of data shown in panel A demonstrating the cell cycle distribution of the 3 cell lines in the respective treatment groups (C) The percentages of cells in G2/M phase of cell cycle are shown. LB-100 significantly enhanced the proportion of cells in G2/M. Data represents the mean ± SEM from at least two independent experiments. *P < 0.05, **P < 0.01< ***P<0.001 and ****P < 0.0001. One way ANOVA with Tukey's multiple comparison test)
