Figure 4.

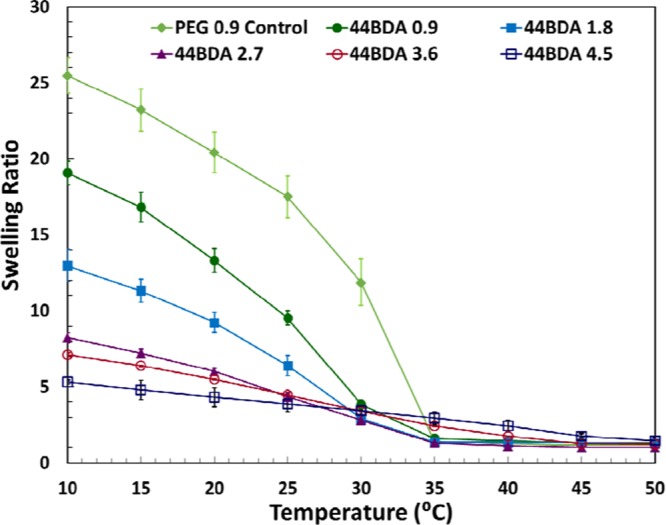
Temperature-dependent swelling profiles of PEG control gel and 44BDA gel set, error bars represent average swelling ratio ± standard deviation where n = 3.

Temperature-dependent swelling profiles of PEG control gel and 44BDA gel set, error bars represent average swelling ratio ± standard deviation where n = 3.