Figure 2.

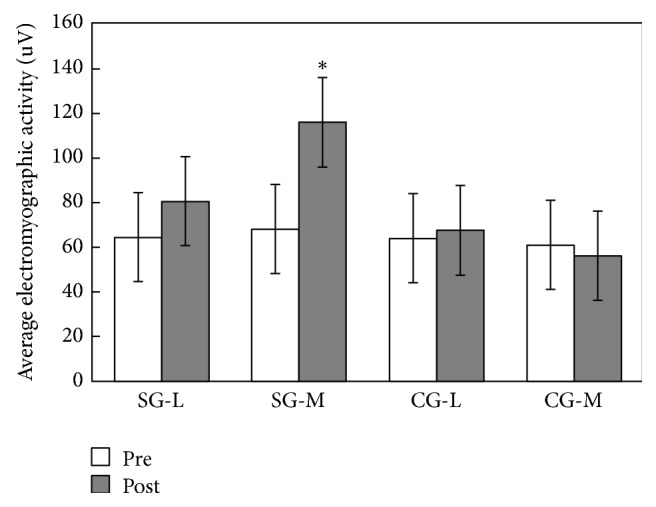
Average electromyographic activity in the SG and CG (mean ± SD). The ∗ indicates significant difference between the pre- and post-Baduanjin exercise values.

Average electromyographic activity in the SG and CG (mean ± SD). The ∗ indicates significant difference between the pre- and post-Baduanjin exercise values.