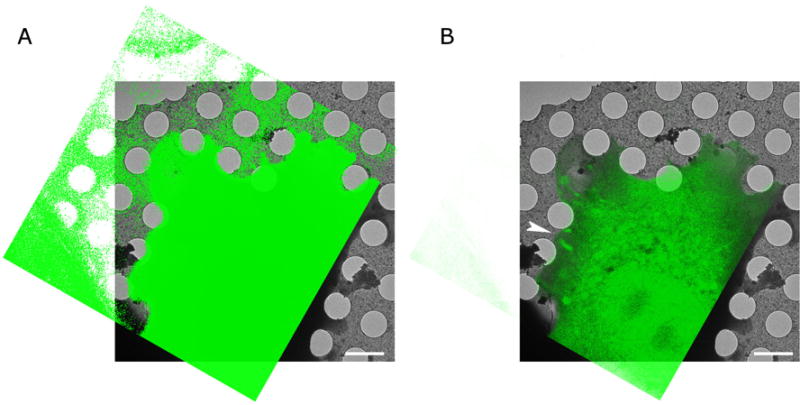
Figure 3. Overlay of Paxilin-GFP fluorescence image (green) with electron cryomicroscopy image (greyscale) after applying the transform determined using the carbon hole center correspondences. Same cell as in Figures 1 and 2.

A. Is shown at high contrast to show the excellent correspondence between the holes. B. Is shown at lower contrast to show the overlay of fluorescence features with the electron cryo-microscopy image. The arrowhead points at the same focal adhesion region as the arrowhead in Figure 1. The bars are 2 microns.
