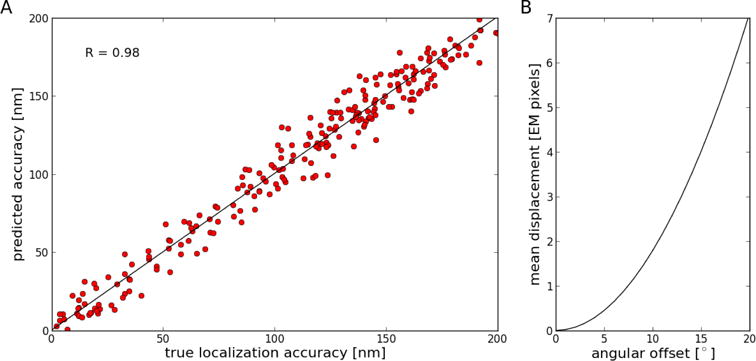
Figure 5. Evaluation of accuracy estimates using simulated images.

A. Correlation between true localization accuracy and accuracy estimated from prediction errors. Linear regression shows that the data is highly correlated (R = 0.98; slope = 1.002; intercept = 0.21). Accuracy is defined here as the mean Euclidean distance between corresponding point-like features. B. Effect of angular offset between images on mean displacement between locations of point-like features in the reference sample versus in the tilted sample. An angular offset of about 7.5° results in a one-pixel mean displacement.
