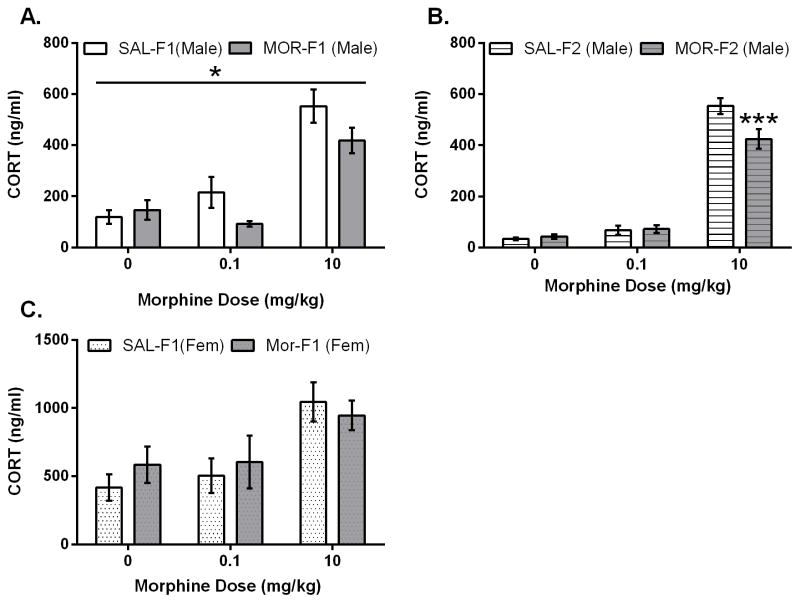
Figure 1.
Mean (±SEM) plasma corticosterone levels (ng/ml) as measure 30 minutes after acute (0, 0.1, 10 mg/kg) morphine administration in adult F1 males (panel A), adult F2 males (panel B), and adult F1 females (panel C). F1 males: Main effect of dose (F[2,66]=37.2; p<0.0001). Main effect of maternal adolescent exposure (F[1,66)=4.081; p<0.05). F2 males: main effect of dose (F[2,57]=247.4; p<0.0001); main effect of grandmaternal adolescent exposure (F[1,57]=4.4; p<0.05); significant interaction (F[2,57]=6.0; p<0.01). *p<0.05 as compared SAL-F1; ***p<0.0001 compared to Sal-F1. F1 females: main effect of dose (F[2,54]=8.1; p<0.001). Sample sizes as follows: Male SAL-F1/MOR-F1; 0 mg/kg N=12/11; 0.1 mg/kg N=12/12; 10 mg/kg N=12/13. Male SAL-F1/MOR-F1; 0 mg/kg N=11/10; 0.1 mg/kg N=10/11; 10 mg/kg N=11/10 Female SAL-F1/MOR-F1; 0 m/kg N=10/10; 0.1 mg/kg N=7/10; 10 mg/kg N=12/11.

