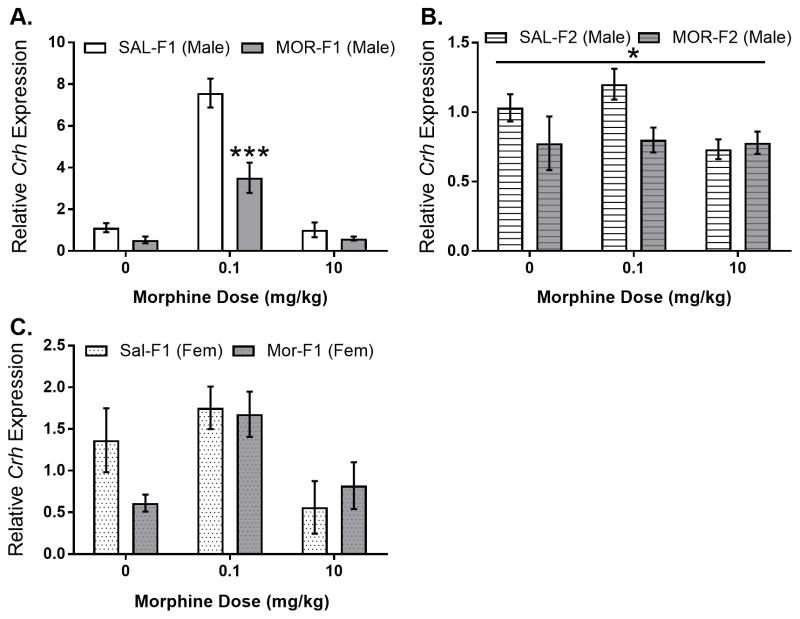
Figure 3.
Mean (±SEM) relative expression of Crh mRNA in the PVN of adult F1 males (panel A), adult F2 males (panel B), and adult F1 females (panel C) as measured 30 minutes after morphine administration (0, 0.1, 10 mg/kg). F1 males: main effect of dose (F[2,36]=96.28; p<0.0001); main effect of maternal adolescent exposure (F[1,36)=32.43; p<0.0001); interaction (F[2,36]=13.68; p<0.0001). Sidak’s post hoc analysis (p<0.0001 at 0.1 mg/kg). F2 males: maternal adolescent exposure (F[1,40]=4.413; p<0.05). F1 females: Main effect of dose (F[2,31)=6.47; p<0.001). All N’s = 6–8 per group.

