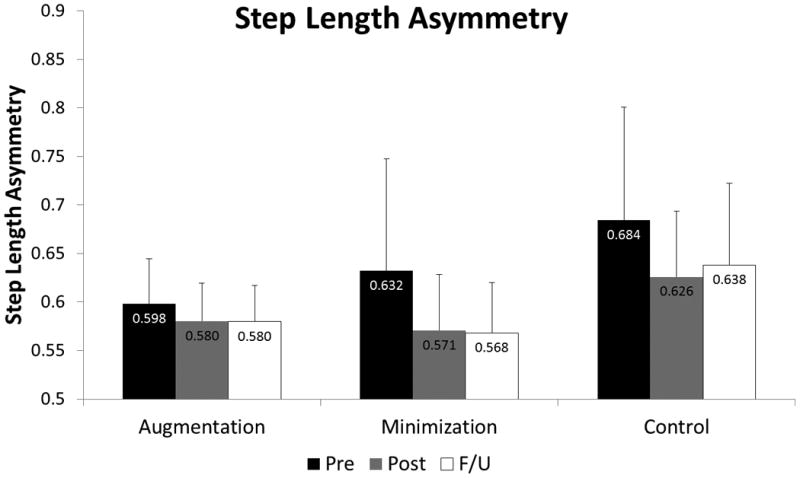
Figure 2.

Step length asymmetry ratio (N=21) at the Pre-test (black), Post-test (gray), and Follow-up (white) time points for the Augmentation, Minimization, and Control groups. A significant effect of time was observed with step length asymmetry reducing from pre-test to post-test and persisting at follow-up.
