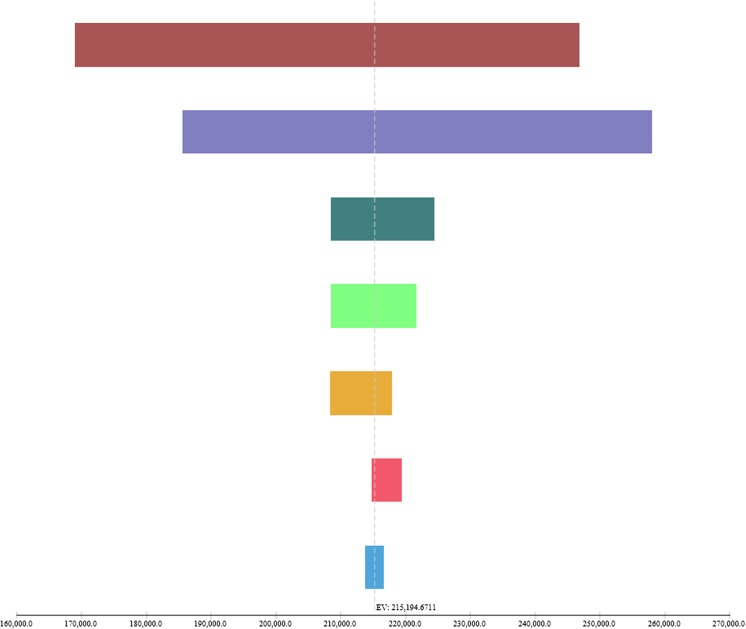
Fig. 2.
One-way sensitivity analyses, tornado diagram. Values are ICER €/QALY with tornado bars representing the effect of univariate sensitivity analyses. Variables were selected based on level of impact (from top to bottom): high-risk probability of the prediction rule, RSV prophylaxis effectiveness in preventing RSV hospitalisations, the RSV hospitalisation incidence in the high-risk population, the hospital admission duration, the probability of PICU admission following RSV hospitalisation, the probability of mortality following PICU admission and the PICU admission duration

