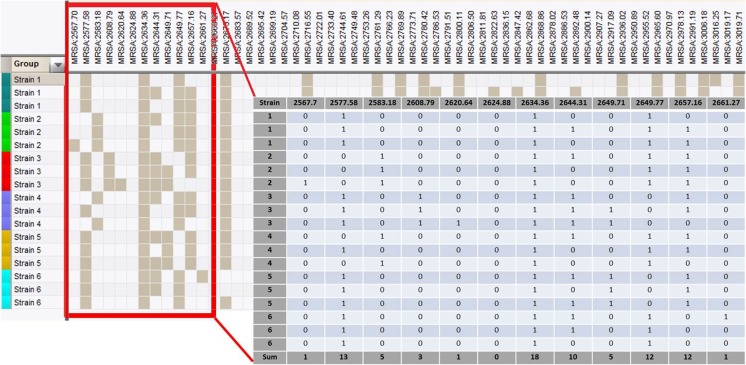
Fig. 1.
Selection of peaks to create Superspectra was performed by analysing presence or absence of particular peaks using the BioNumerics software. The frequency of peaks from a selection of 111 Superspectra strains belonging to certain PFGE-types was analysed both within the specific PFGE-types as well as within the whole Superspectra strain population. Filled squares indicate presence of a specific peak and empty squares indicate absence of this peak. The patterns of absent/present peaks were imported into an Excel sheet in which present peaks are designated 1 and absent designated 0 (as demonstrated by the magnified selection). The sum of each column (peak) indicates the frequency of a particular peak within the population studied (single PFGE-type or the whole Superspectra strain population)

